I. Overview
Data visualization provides the function of custom chart templates to meet business requirements that cannot be satisfied by existing chart templates.
II. How to Use
- Click "Chart Templates" at the top of the data visualization page
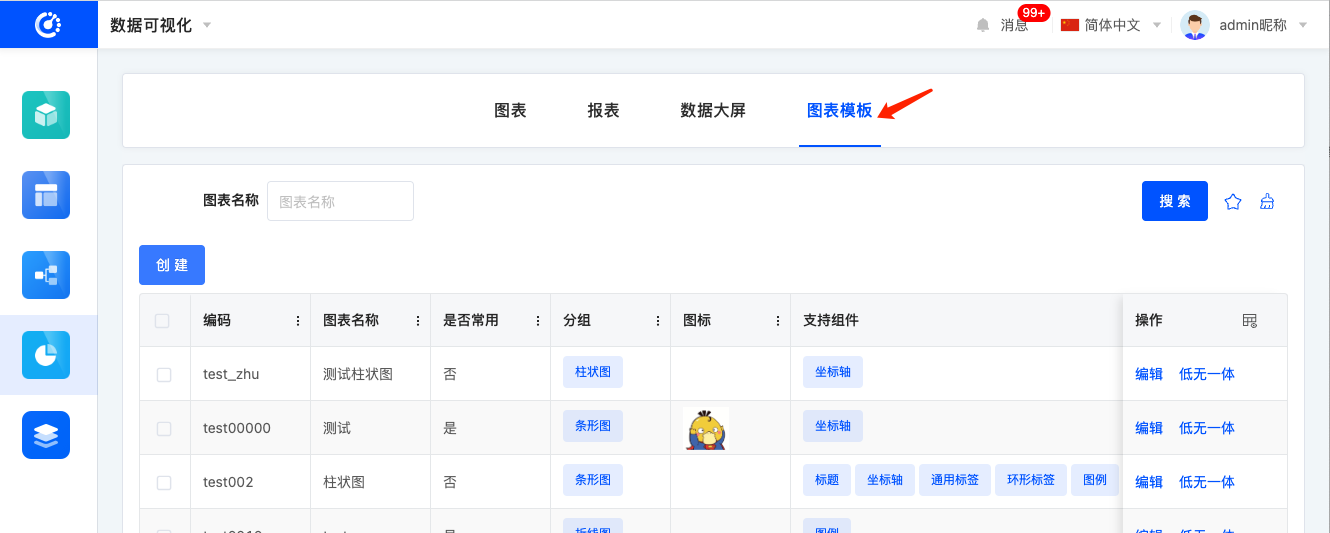
- Click the
Createbutton to pop up the chart template form, fill it in and submit for saving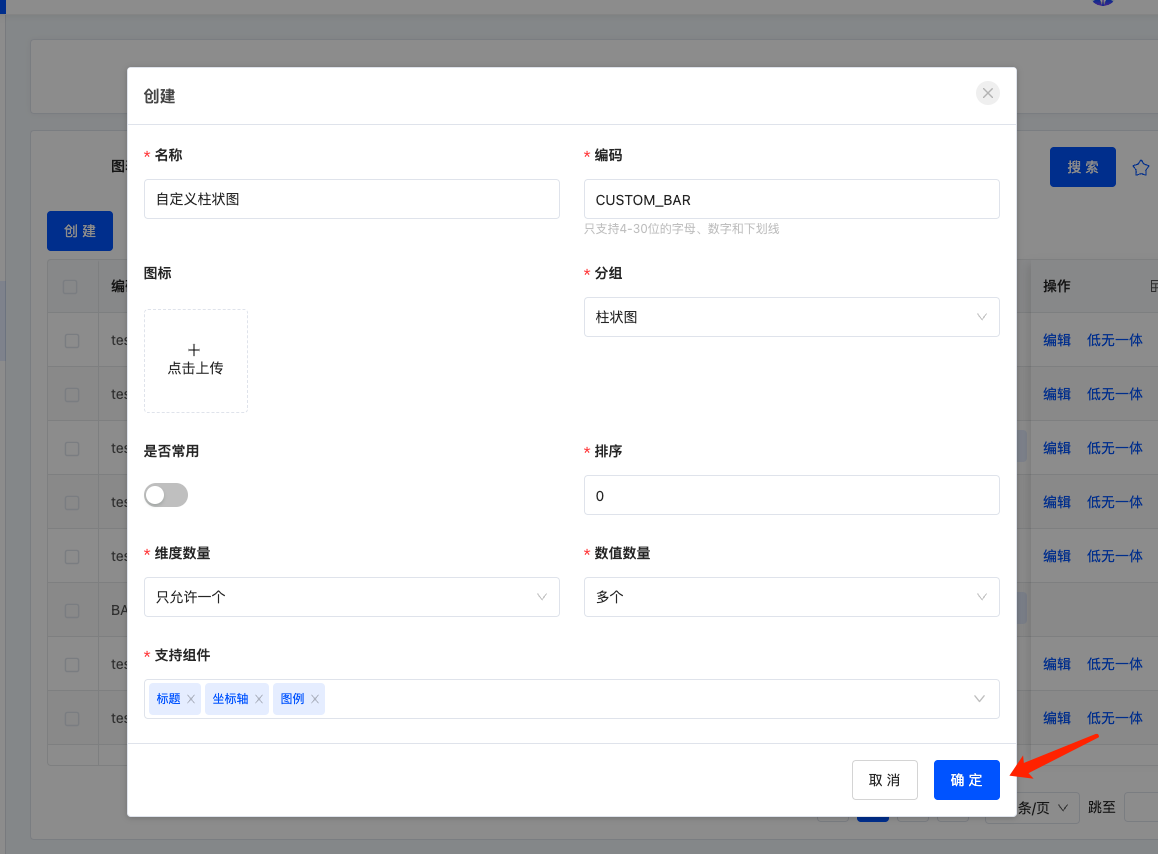
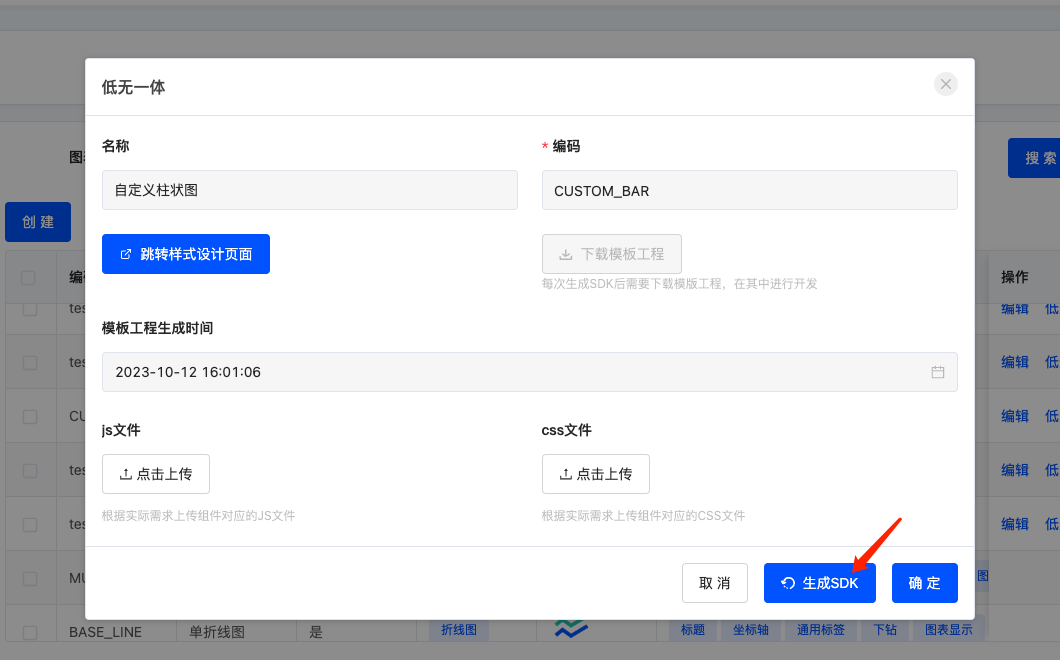
- Locate the newly created chart template and click the "Low-Code & No-Code Integration" button in the operation bar
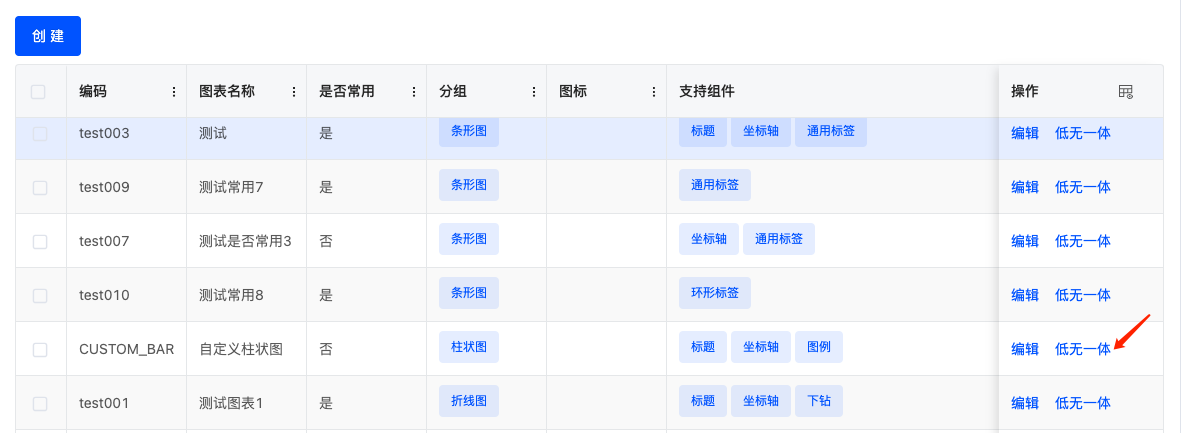
- Click the "Generate SDK" button at the bottom of the pop-up window
- After completing the above operation, the page will refresh. Locate the data again, click the "Low-Code & No-Code Integration" button. Now the "Download Template Project" button is clickable. Click it to download the sample code package
kunlun-chart-sdk.zipfor the custom chart template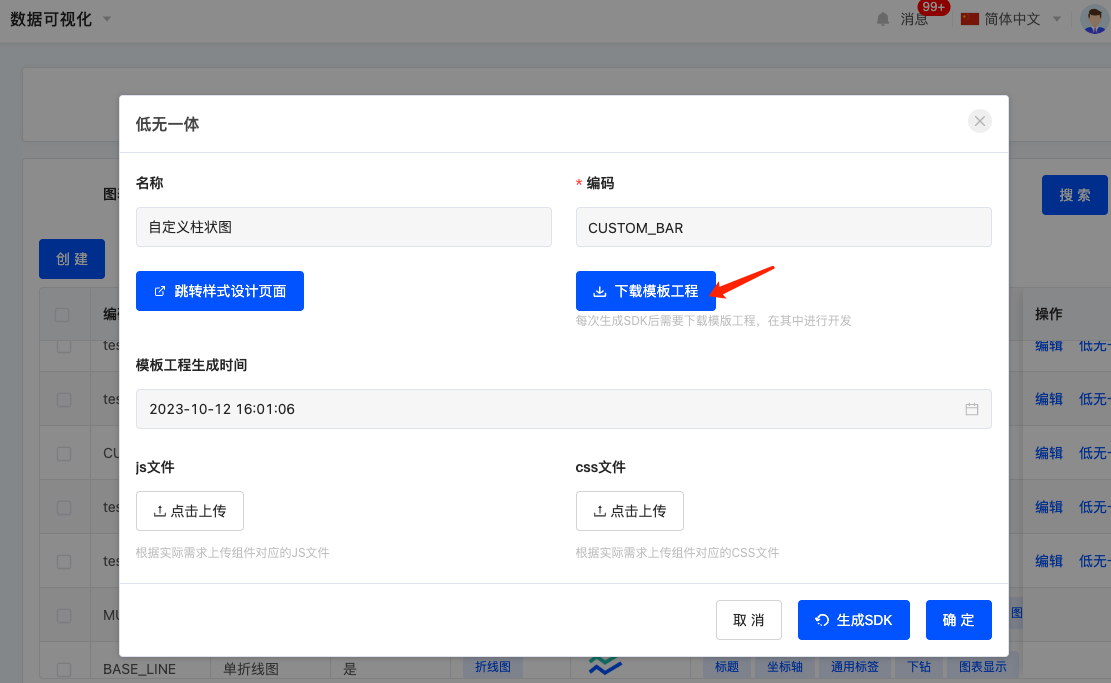
- After unzipping
kunlun-chart-sdk.zip, view the project structure. Executenpm iin the root directory to install dependencies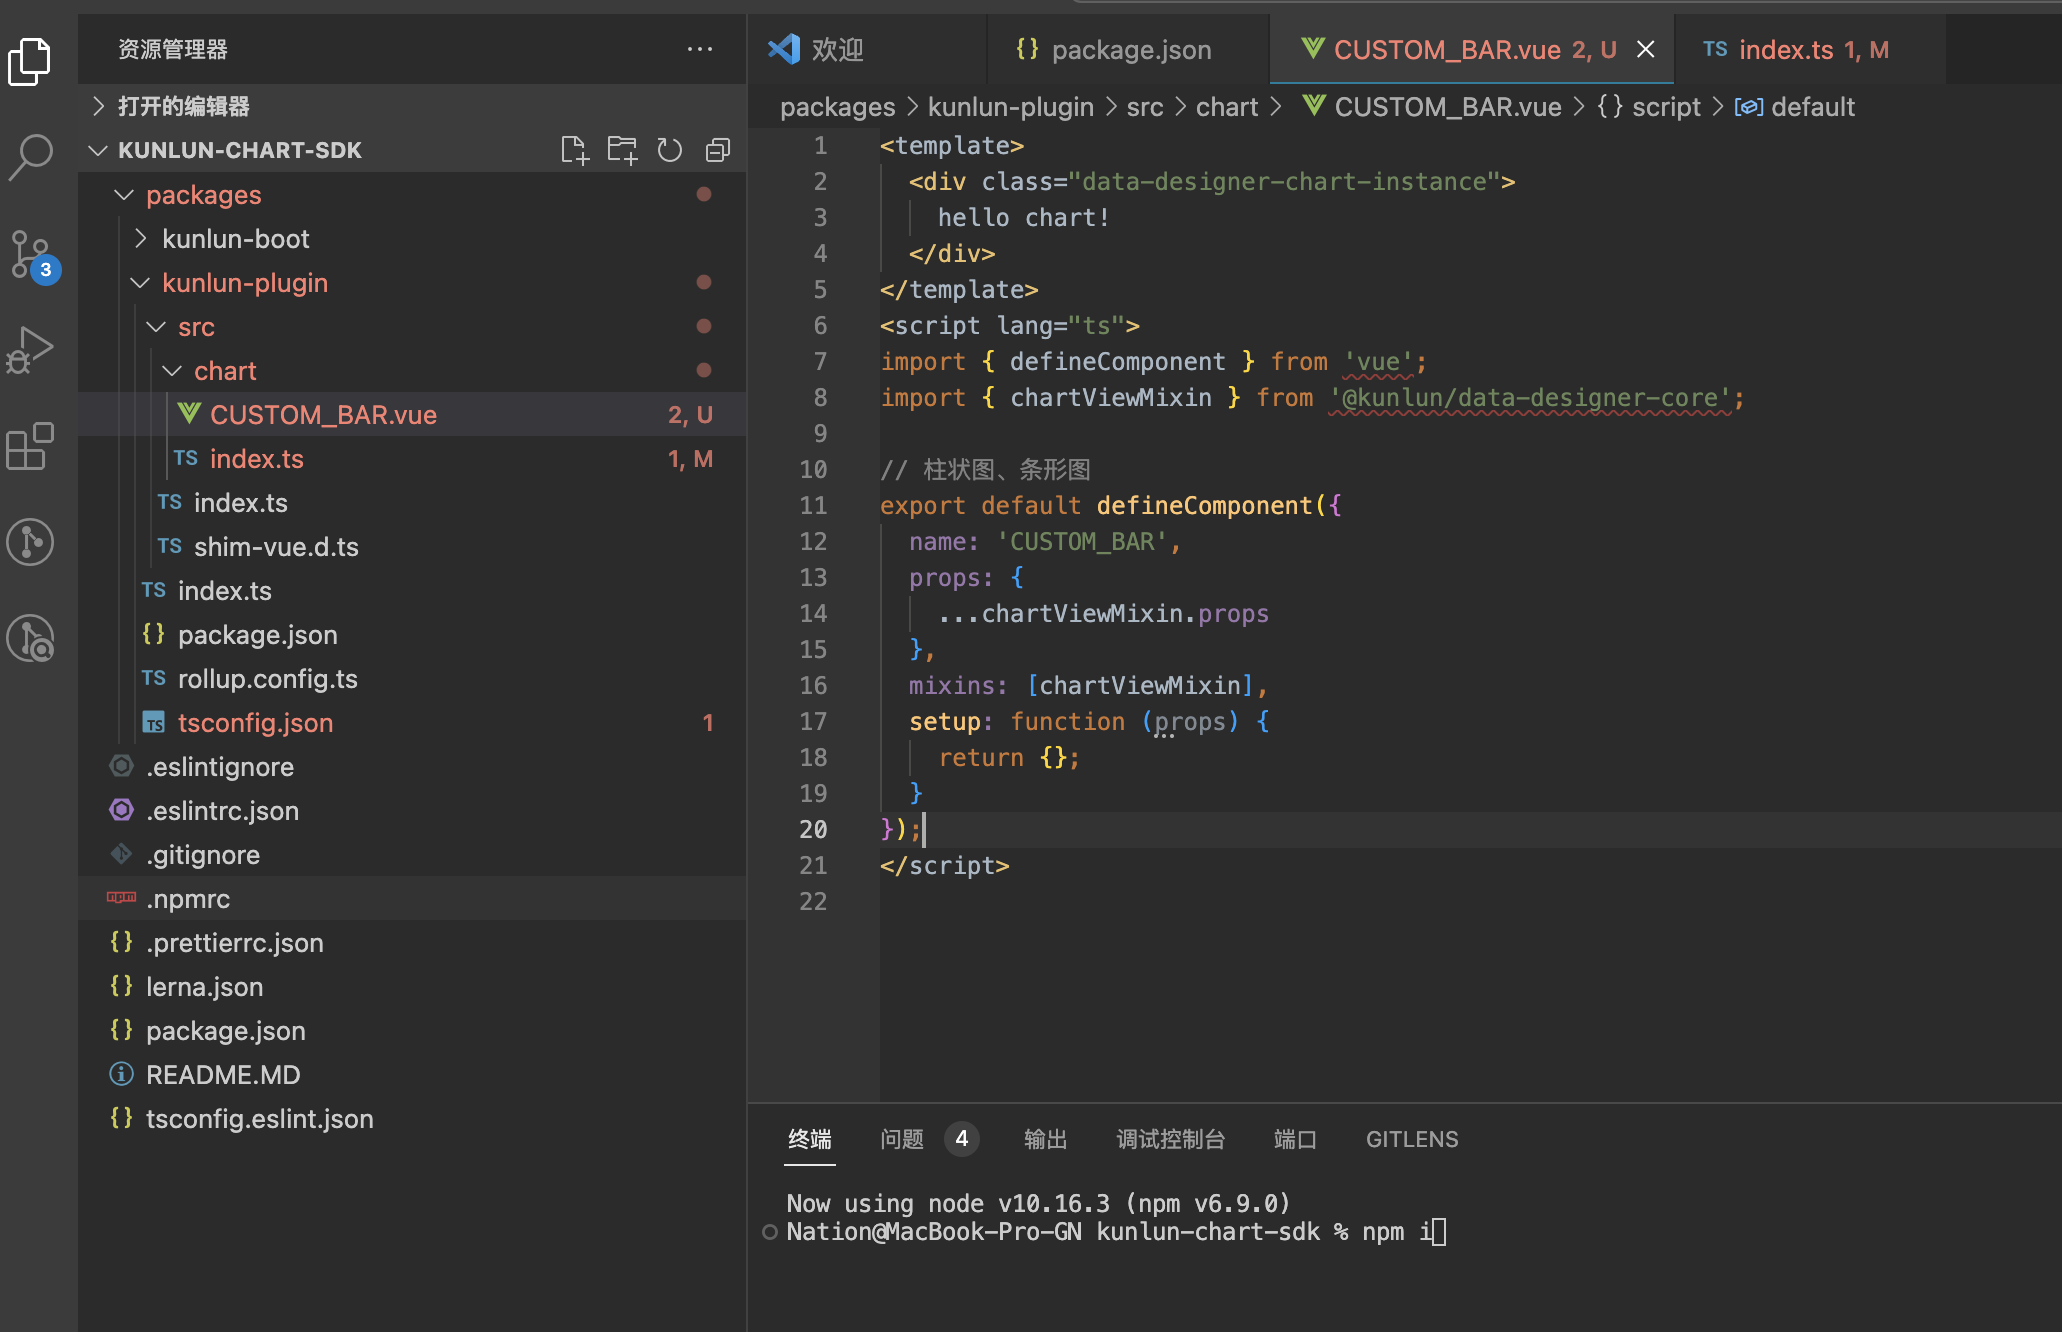
- The custom chart Vue component is located at
packages/kunlun-plugin/src/chart/CUSTOM_BAR.vue, where you can modify the custom display and logical processing - After completing the custom code, run
npm run buildin the root directory to package the code. The packaged JS and CSS files will be found inpackages/kunlun-plugin/dist(CSS file will not be generated if there is no CSS in the template, which can be ignored)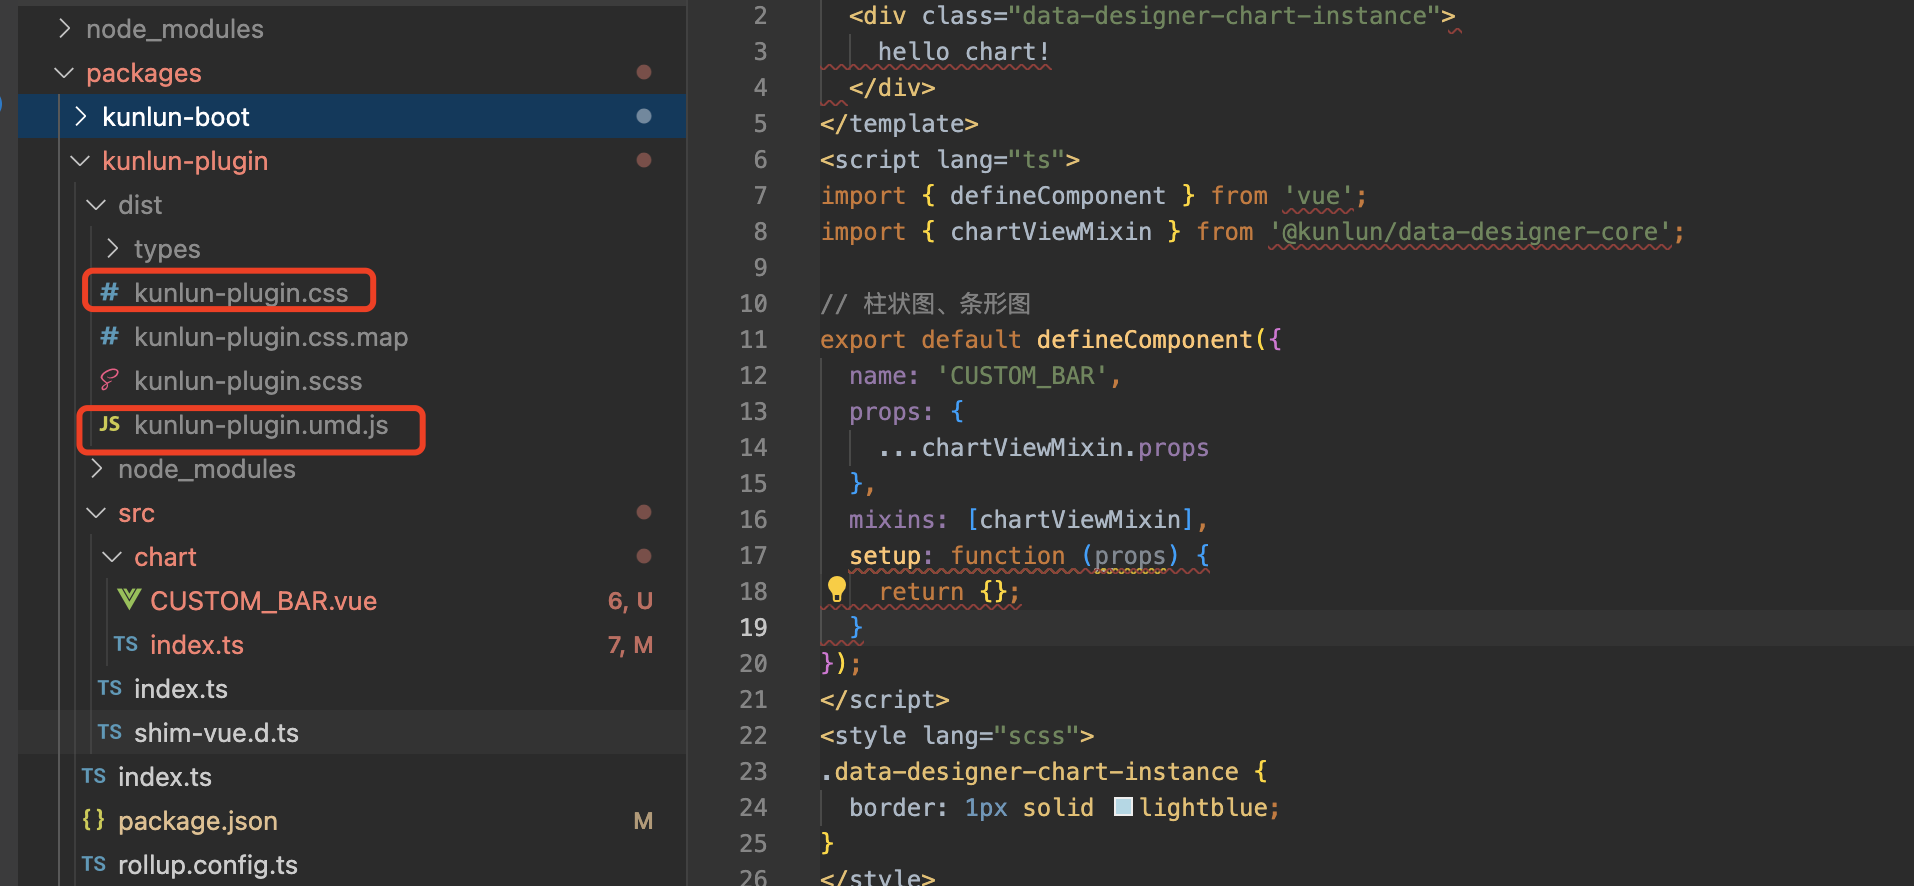
- Return to the management page of custom chart templates, locate the corresponding data row, click the "Low-Code & No-Code Integration" button again. Upload the generated
kunlun-plugin.umd.jsandkunlun-plugin.cssfiles in the pop-up window, then click "Confirm" at the bottom to save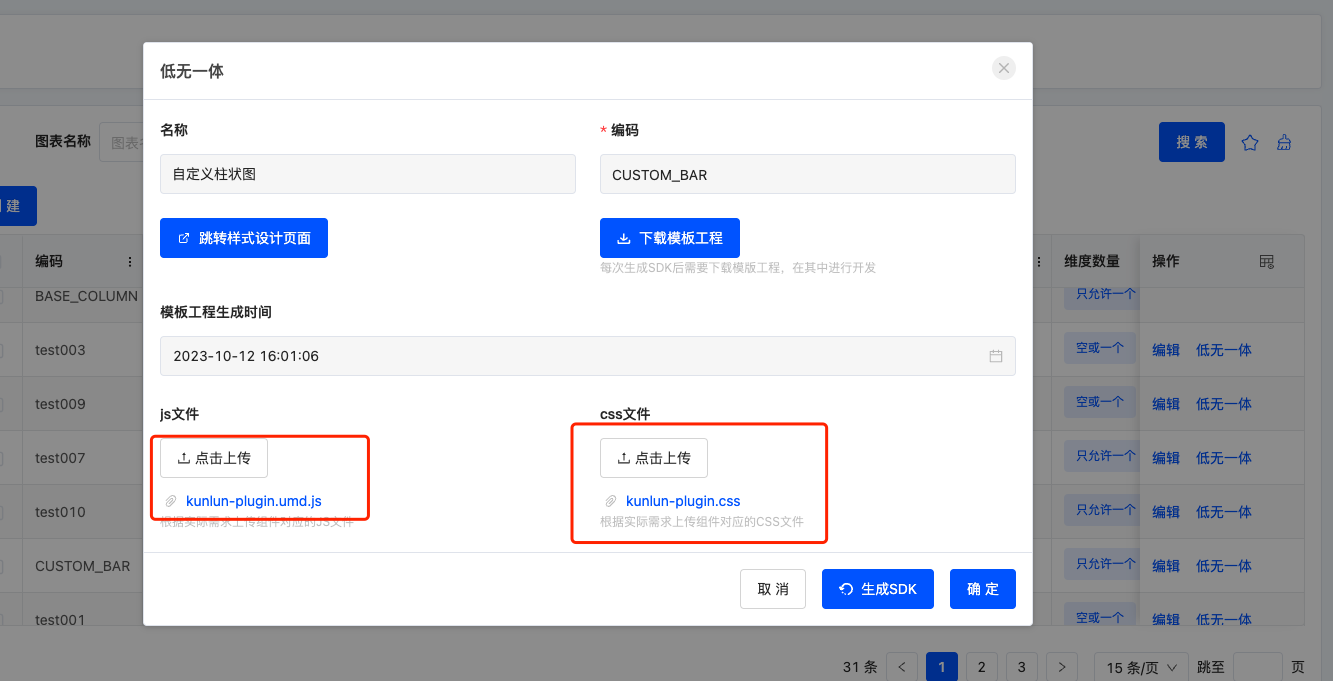
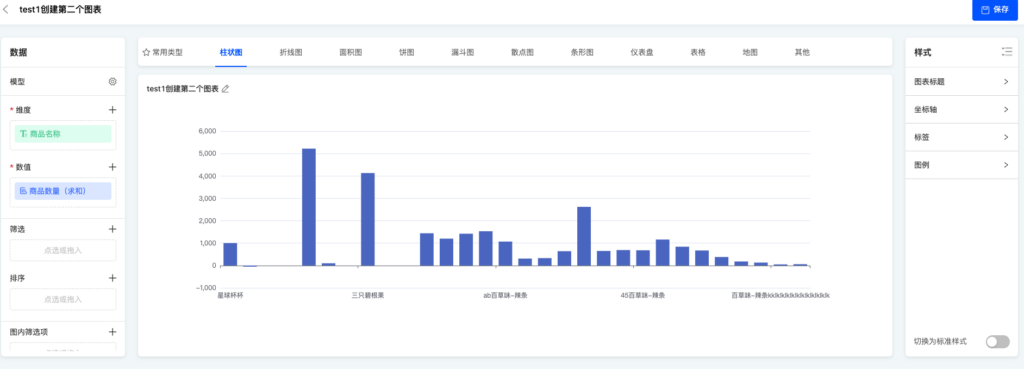
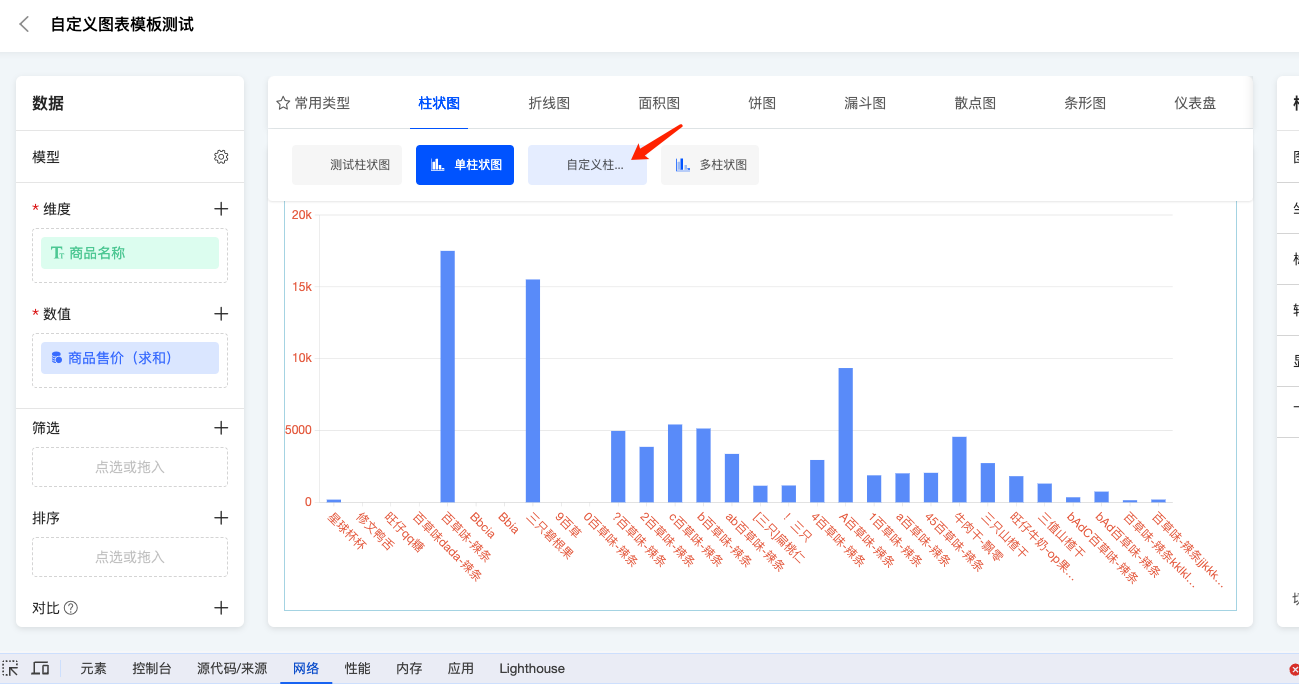
- Enter the chart editing page, and in the chart category selection, you can see the newly added subcategory "Custom Bar Chart" under the bar chart category. Click to switch
- After switching, the chart will change from the default bar chart to the custom chart with a blue border and the text
hello chartinside.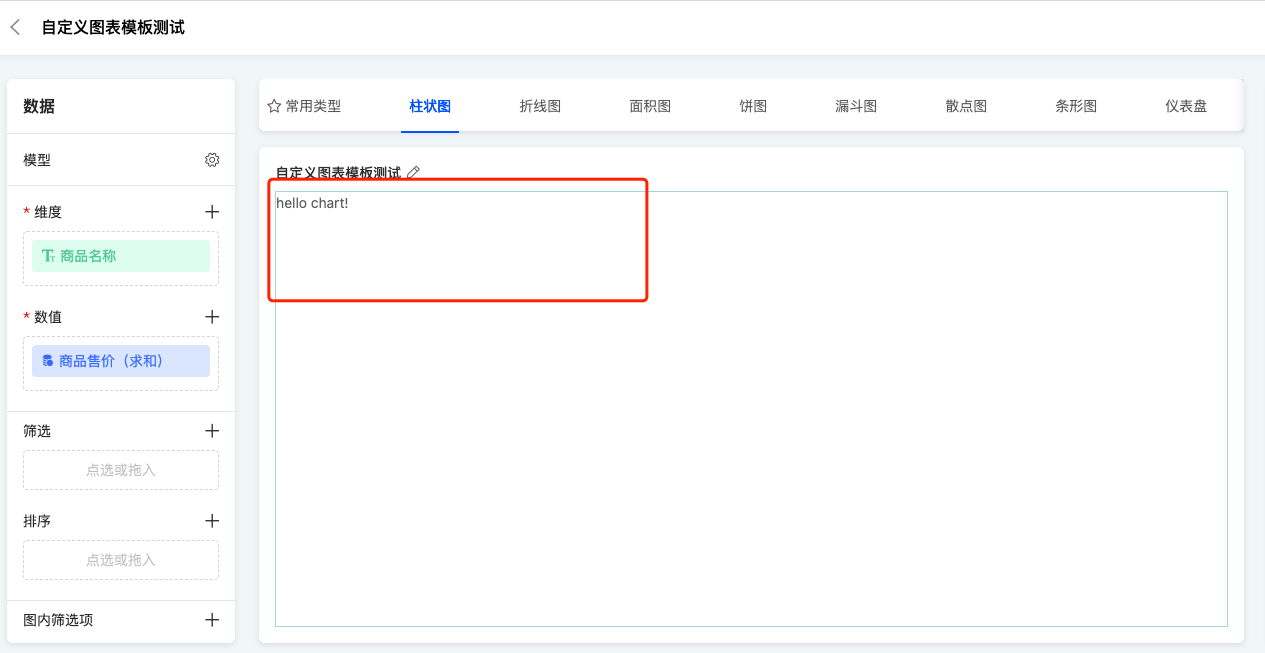
II. Example Custom Chart Component
This example implements a bar chart using the echarts library, while the framework's built-in bar chart uses the G2 library. demo-echarts-bar.vue
vue
<template>
  <div class="data-designer-chart-instance demo-echarts-bar" ref="designerChartViewRef">
    <div class="data-designer-chart-container" ref="designerChartViewInnerRef"></div>
  </div>
</template>
<script lang="ts">
  import { defineComponent, onMounted, ref, watch } from 'vue';
  import DataSet from '@antv/data-set';

  import * as echarts from 'echarts/core';
  import { ECharts, EChartsCoreOption } from 'echarts/core';
  import { GridComponent } from 'echarts/components';
  import { BarChart, BarSeriesOption } from 'echarts/charts';
  import { CanvasRenderer } from 'echarts/renderers';
  import { deepClone } from '@oinone/kunlun-dependencies';
  import {
    filterDimensionScaleColumns,
    isSameObj,
    ChartTypeEnum,
    IChartData,
    IChartDataResult,
    chartViewMixin,
    isNeedRerenderChart,
    isShowChatView,
    watchEchartsSize,
    ChartRenderEngine
  } from '@oinone/kunlun-data-designer-core';

  echarts.use([GridComponent, BarChart, CanvasRenderer]);

  export default defineComponent({
    props: {
      ...chartViewMixin.props
    },
    data() {
      return {
        engine: ChartRenderEngine.ECHARTS,
        chartType: [ChartTypeEnum.MAP_CHINA]
      };
    },
    mixins: [chartViewMixin],
    setup(props, { emit }) {
      const chart = ref<ECharts>();
      const designerChartViewRef = ref<HTMLElement>(null as any);
      const designerChartViewInnerRef = ref<HTMLElement>(null as any);
      onMounted(() => {
        initChart();
      });
      let option = {} as EChartsCoreOption;

      function initChart() {
        chart.value = echarts.init(designerChartViewInnerRef.value);
        option = {
          yAxis: {
            type: 'value'
          }
        };
      }

      let oldChartData = {} as IChartData;
      watch(
        () => props.chartData,
        (newVal) => {
          if (!newVal || !chart.value) {
            return;
          }
          if (!isNeedRerenderChart(newVal, oldChartData)) {
            oldChartData = deepClone(newVal);
            return;
          }
          render(chart.value!, newVal, props.chartDataResult);
          oldChartData = deepClone(newVal);
        },
        {
          immediate: true,
          deep: true
        }
      );
      let oldChartDataResult = {} as IChartDataResult;

      function watchDataList(chartData: IChartData, chartDataResult: IChartDataResult) {
        oldChartDataResult = deepClone(props.chartDataResult);
        if (!chart.value) {
          initChart();
        }
        render(chart.value!, chartData, chartDataResult);
      }

      // 监听数据的变动自动重新渲染
      watch(
        () => props.chartDataResult.data,
        () => {
          if (isSameObj(oldChartDataResult, props.chartDataResult)) {
            return;
          }
          if (!designerChartViewRef.value) {
            onMounted(() => {
              watchDataList(props.chartData, props.chartDataResult);
            });
          } else {
            watchDataList(props.chartData, props.chartDataResult);
          }
        },
        { immediate: true, deep: true }
      );

      /**
     * 自定义渲染逻辑
     * @param chart echarts图表对象
     * @param chartData 图表模板的定义
     * @param chartDataResult chartDataResult.data存放的是后端返回的图表数据
     */
      function render(chart: ECharts, chartData: IChartData, chartDataResult: IChartDataResult) {
        if (!isShowChatView(chartData)) {
          return;
        }
        if (!isSameObj(chartData, chartDataResult.chartData)) {
          return;
        }

        const {
          scales = [],
          dimensions = [],
        } = filterDimensionScaleColumns(chartData);

        const dataList = !scales.length || !dimensions.length ? [] : ((chartDataResult.data! || []) as any[]);

        dataList.forEach((a) => {
          if (dimensions.length && !a.name) {
            a.name = a[dimensions[0].chartField.displayName];
          }
          if (scales.length && !a.value) {
            a.value = a[scales[0].chartField.displayName] || null;
          }
        });
        const dv = new DataSet.DataView().source(dataList);

        option.xAxis = {
          type: 'category',
          data: dv.rows?.map((a) => a?.name)
        };
        option.series = [
          {
            type: 'bar',
            data: dv.rows?.map((a) => a?.value)
          } as BarSeriesOption
        ];
        chart.setOption(option);
      }

      // 监听图表容器大小
      watchEchartsSize(props, chart!);

      return { designerChartViewRef, designerChartViewInnerRef, chart };
    }
  });
</script>(Ⅰ) Registering the Template
typescript
import { ChartRenderEngine, ChartRenderType, registerChartComponent } from '@oinone/kunlun-data-designer-core';
import component from './demo-echarts-bar.vue';

registerChartComponent({
  engine: ChartRenderEngine.ECHARTS,
  render: ChartRenderType.CANVAS,
  chartTemplateCode: 'test002'
},
  {
    component
  } as any
);(Ⅲ) Effect Display