Charts can intuitively display data in models. In data visualization, a chart management interface is provided, which allows users to customize chart information and achieve flexible configuration of information.
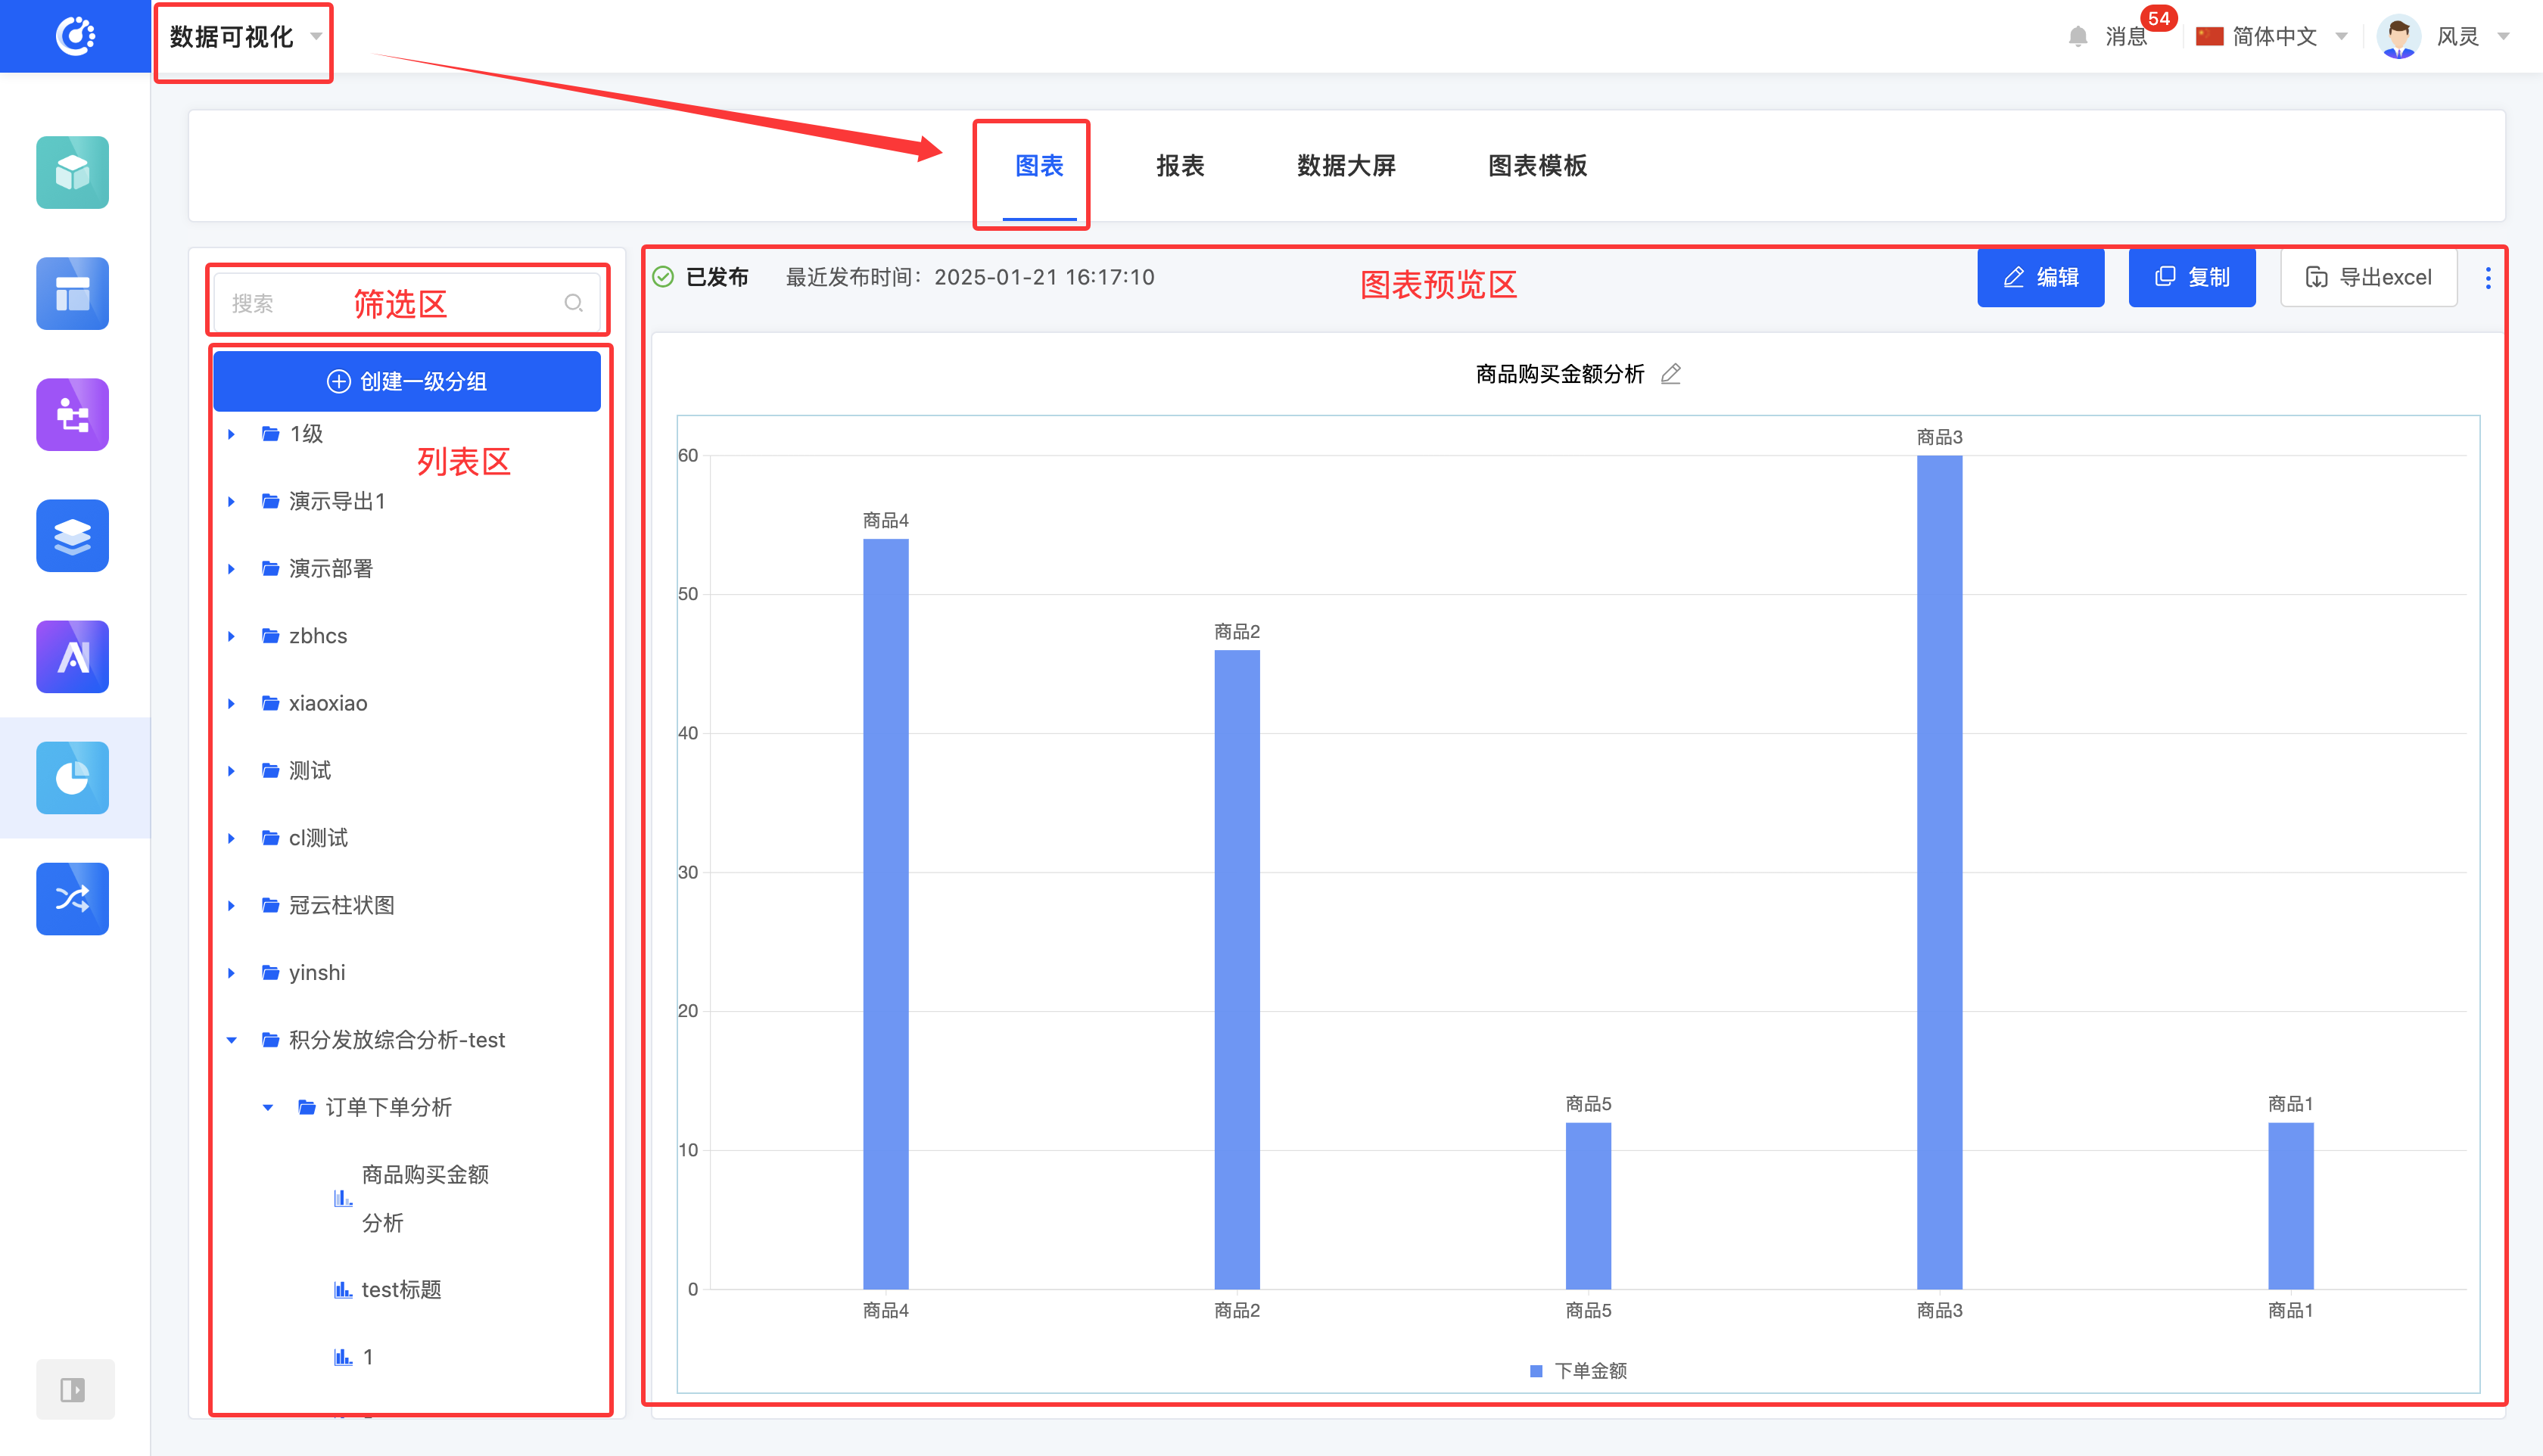
You can manage charts on the "Charts" page after entering data visualization. This page mainly consists of three parts: the filtering area, the list area, and the chart preview area:
- Filtering Area: Provides a chart filtering function to help users quickly find the required chart items.
- List Area: Displays a list of charts and their groups, clearly presenting the chart structure.
- Chart Preview Area: Displays the designed charts. Users can perform operations such as editing, publishing, and exporting here.
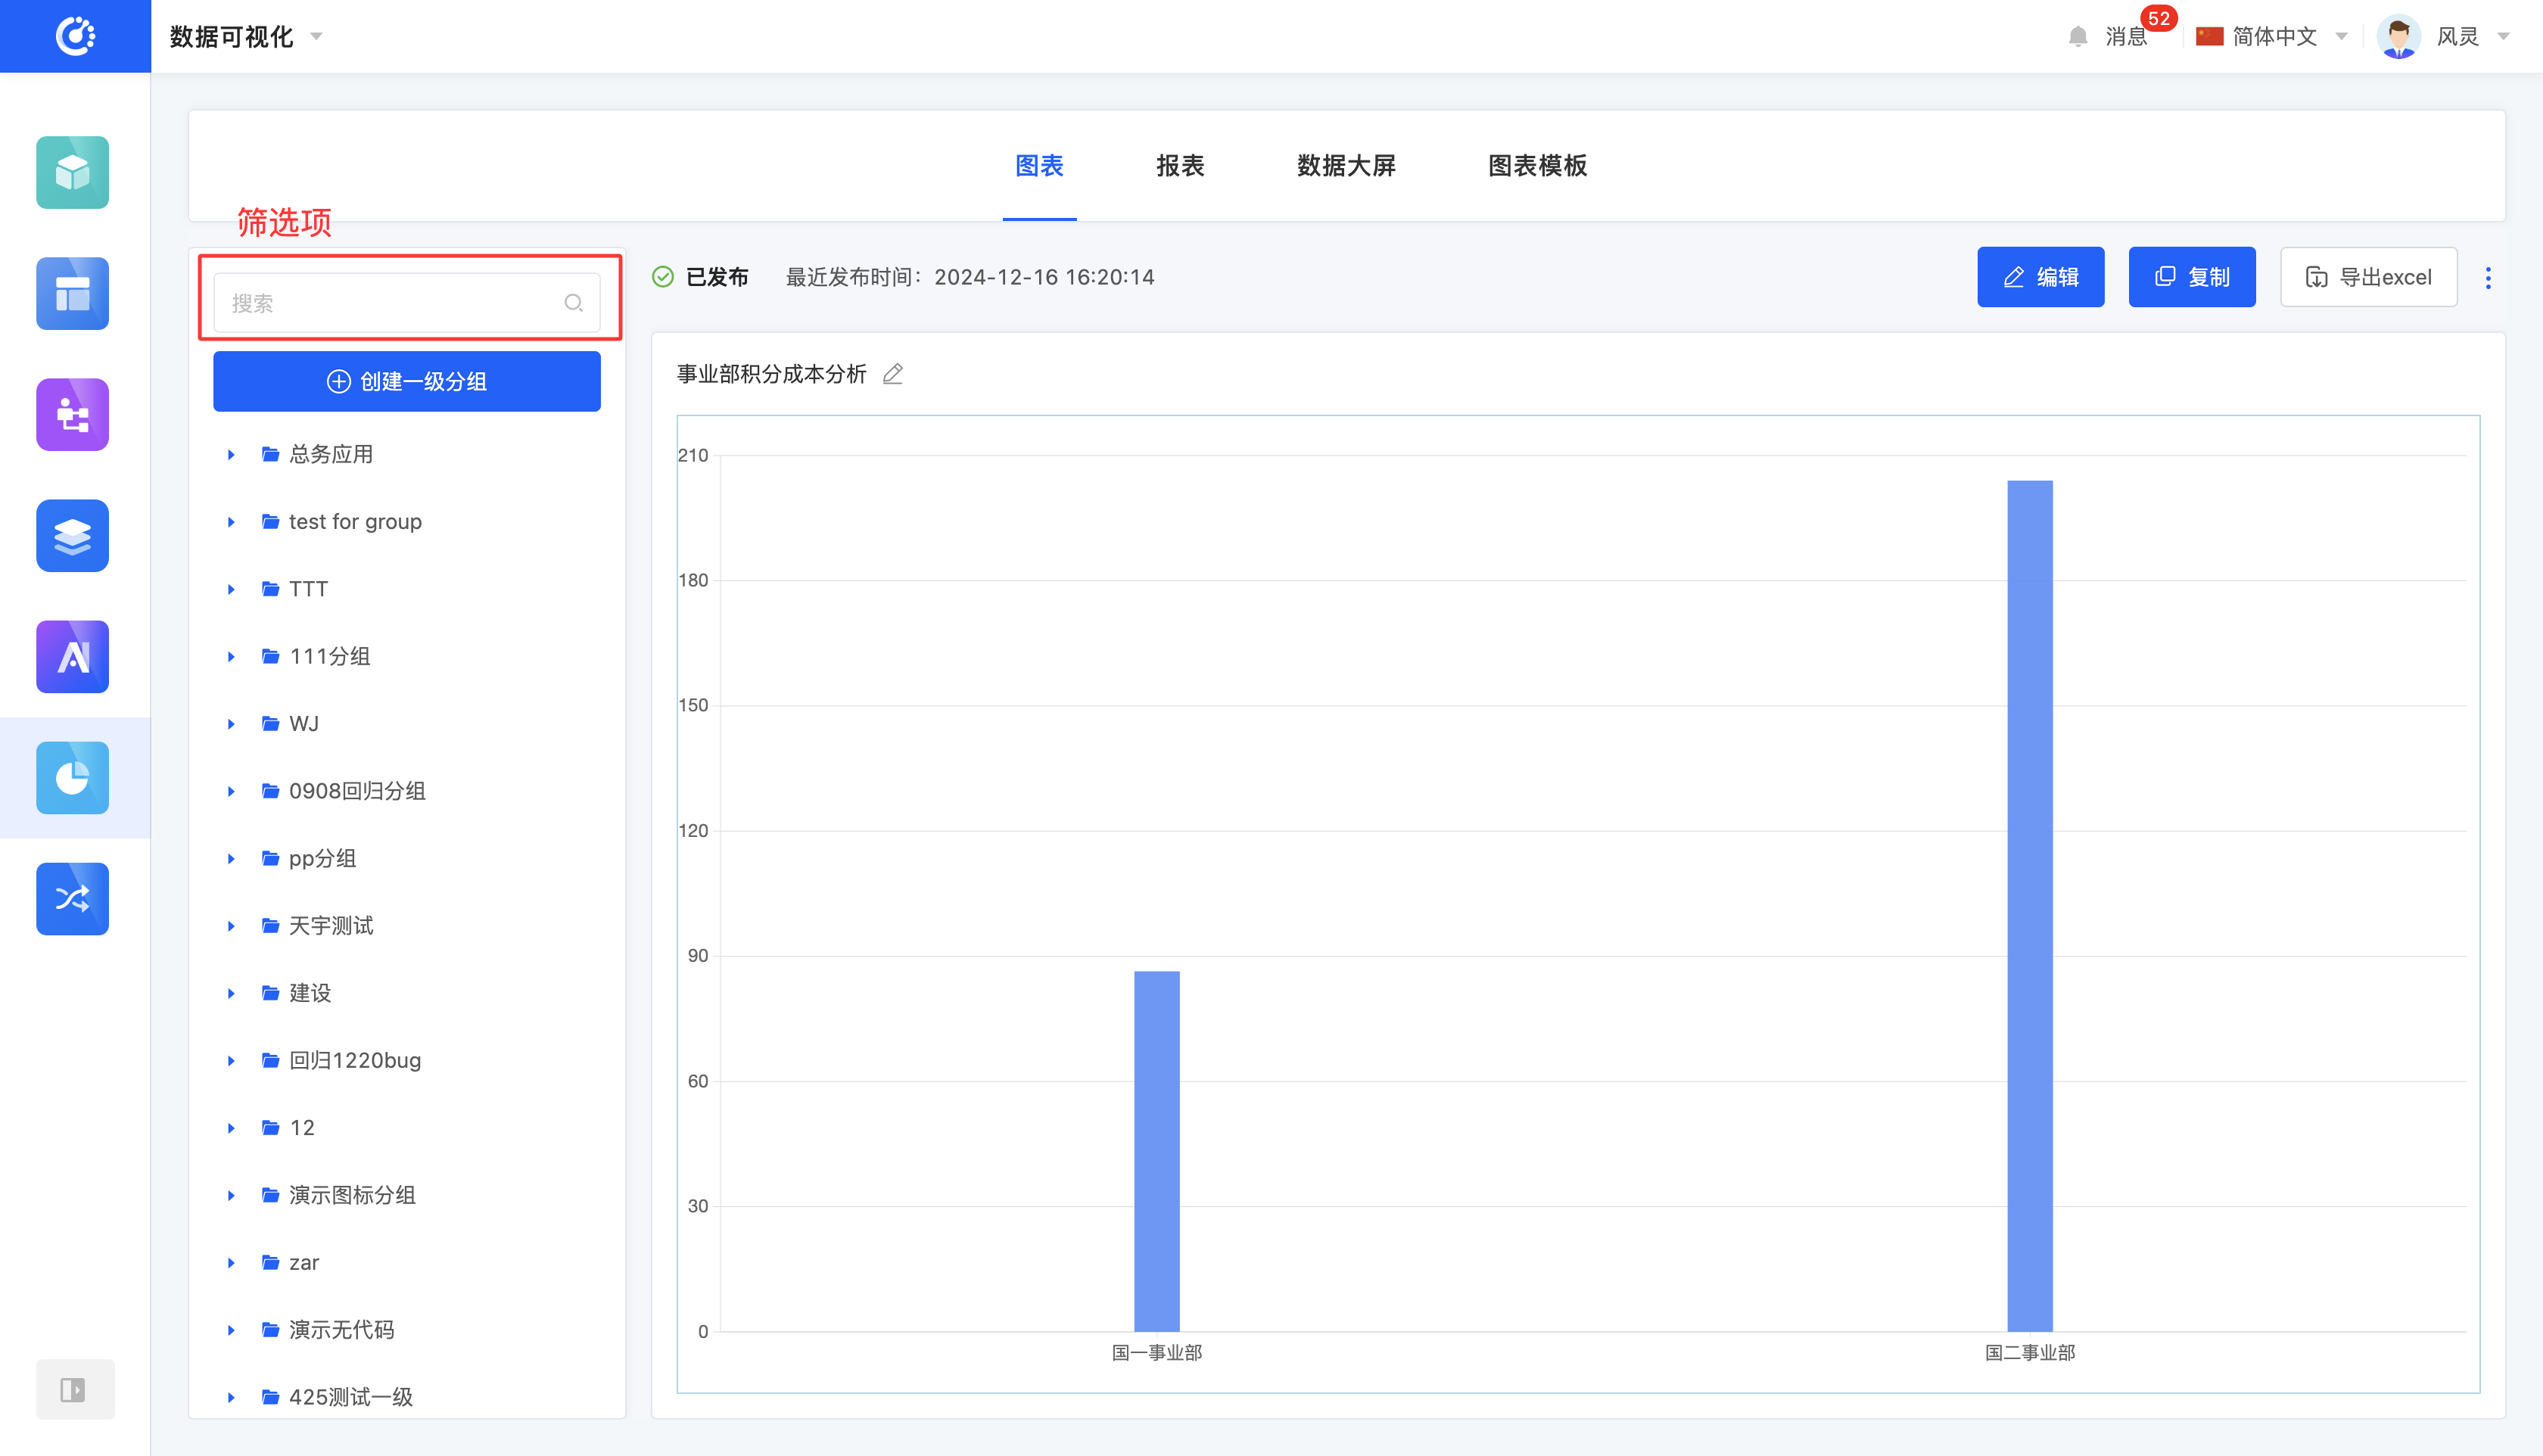
I. Filtering
1. Function Introduction
You can customize chart filtering conditions according to actual business needs. After entering the chart or group name, the system can accurately filter the required items for subsequent operations.
2. Operation Method
Enter conditions in the filtering area to filter charts or groups.
II. Group Management
1. Function Introduction
You can use the grouping function to classify charts.
2. Operation Method
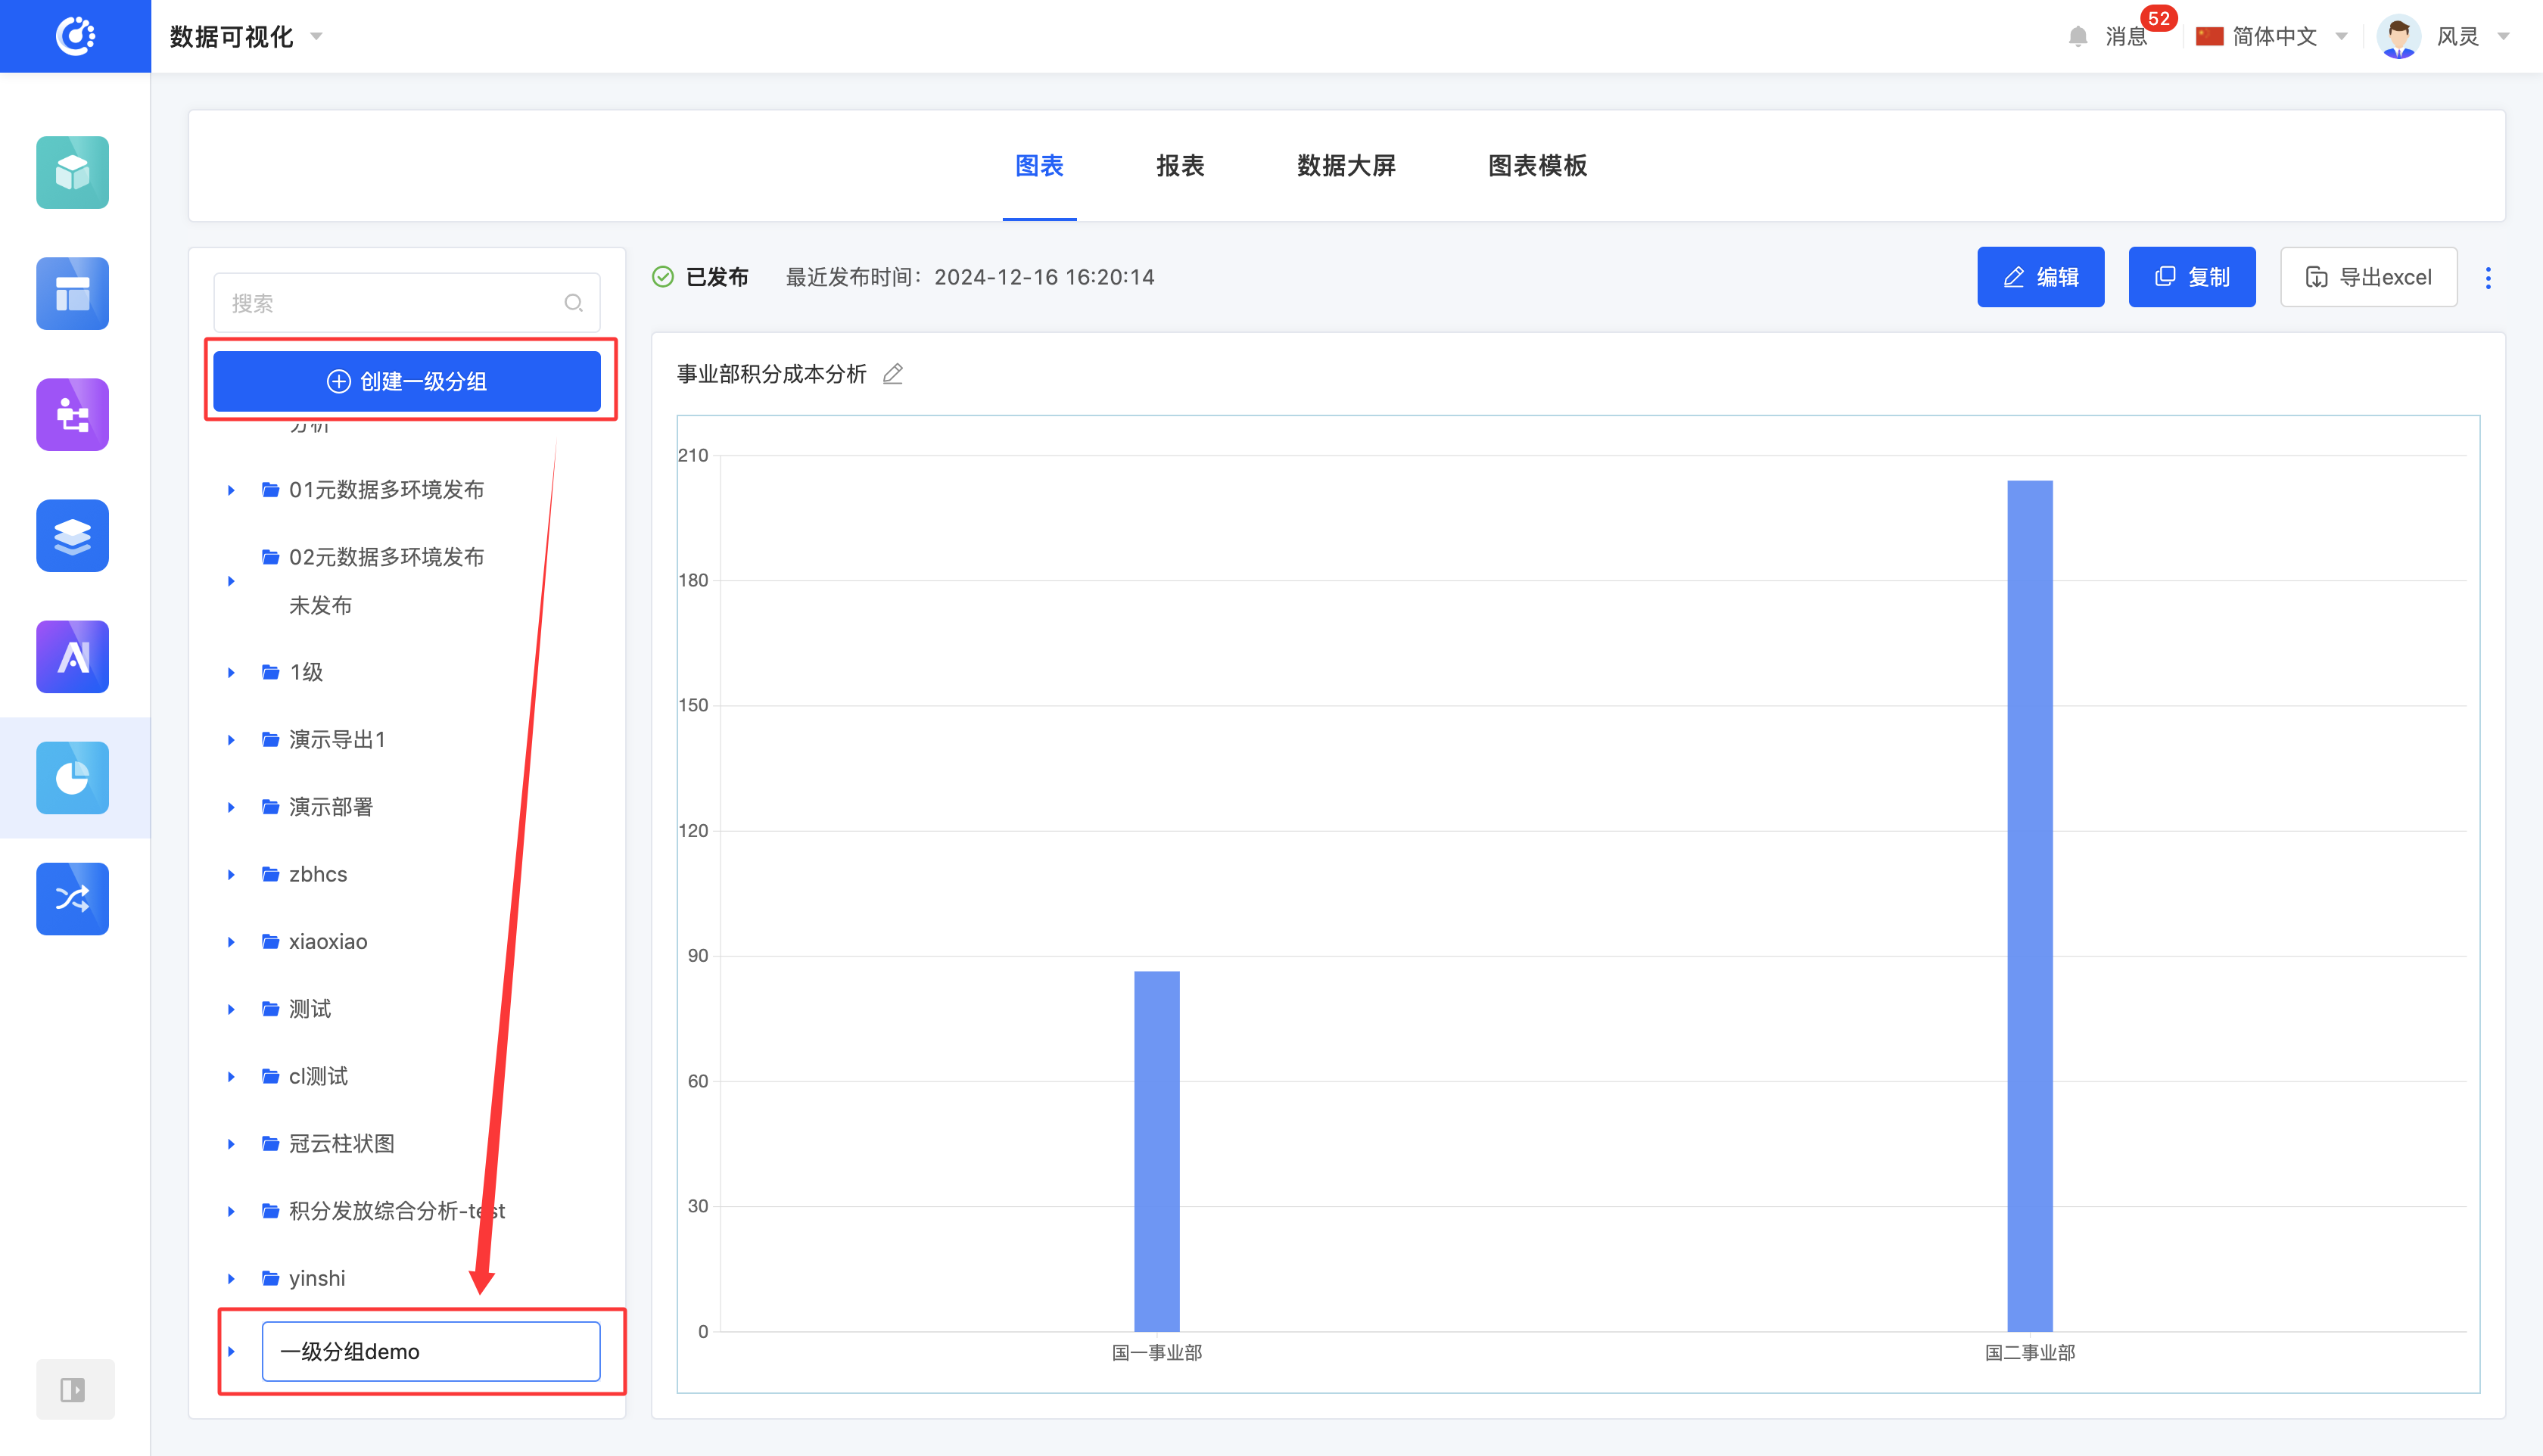
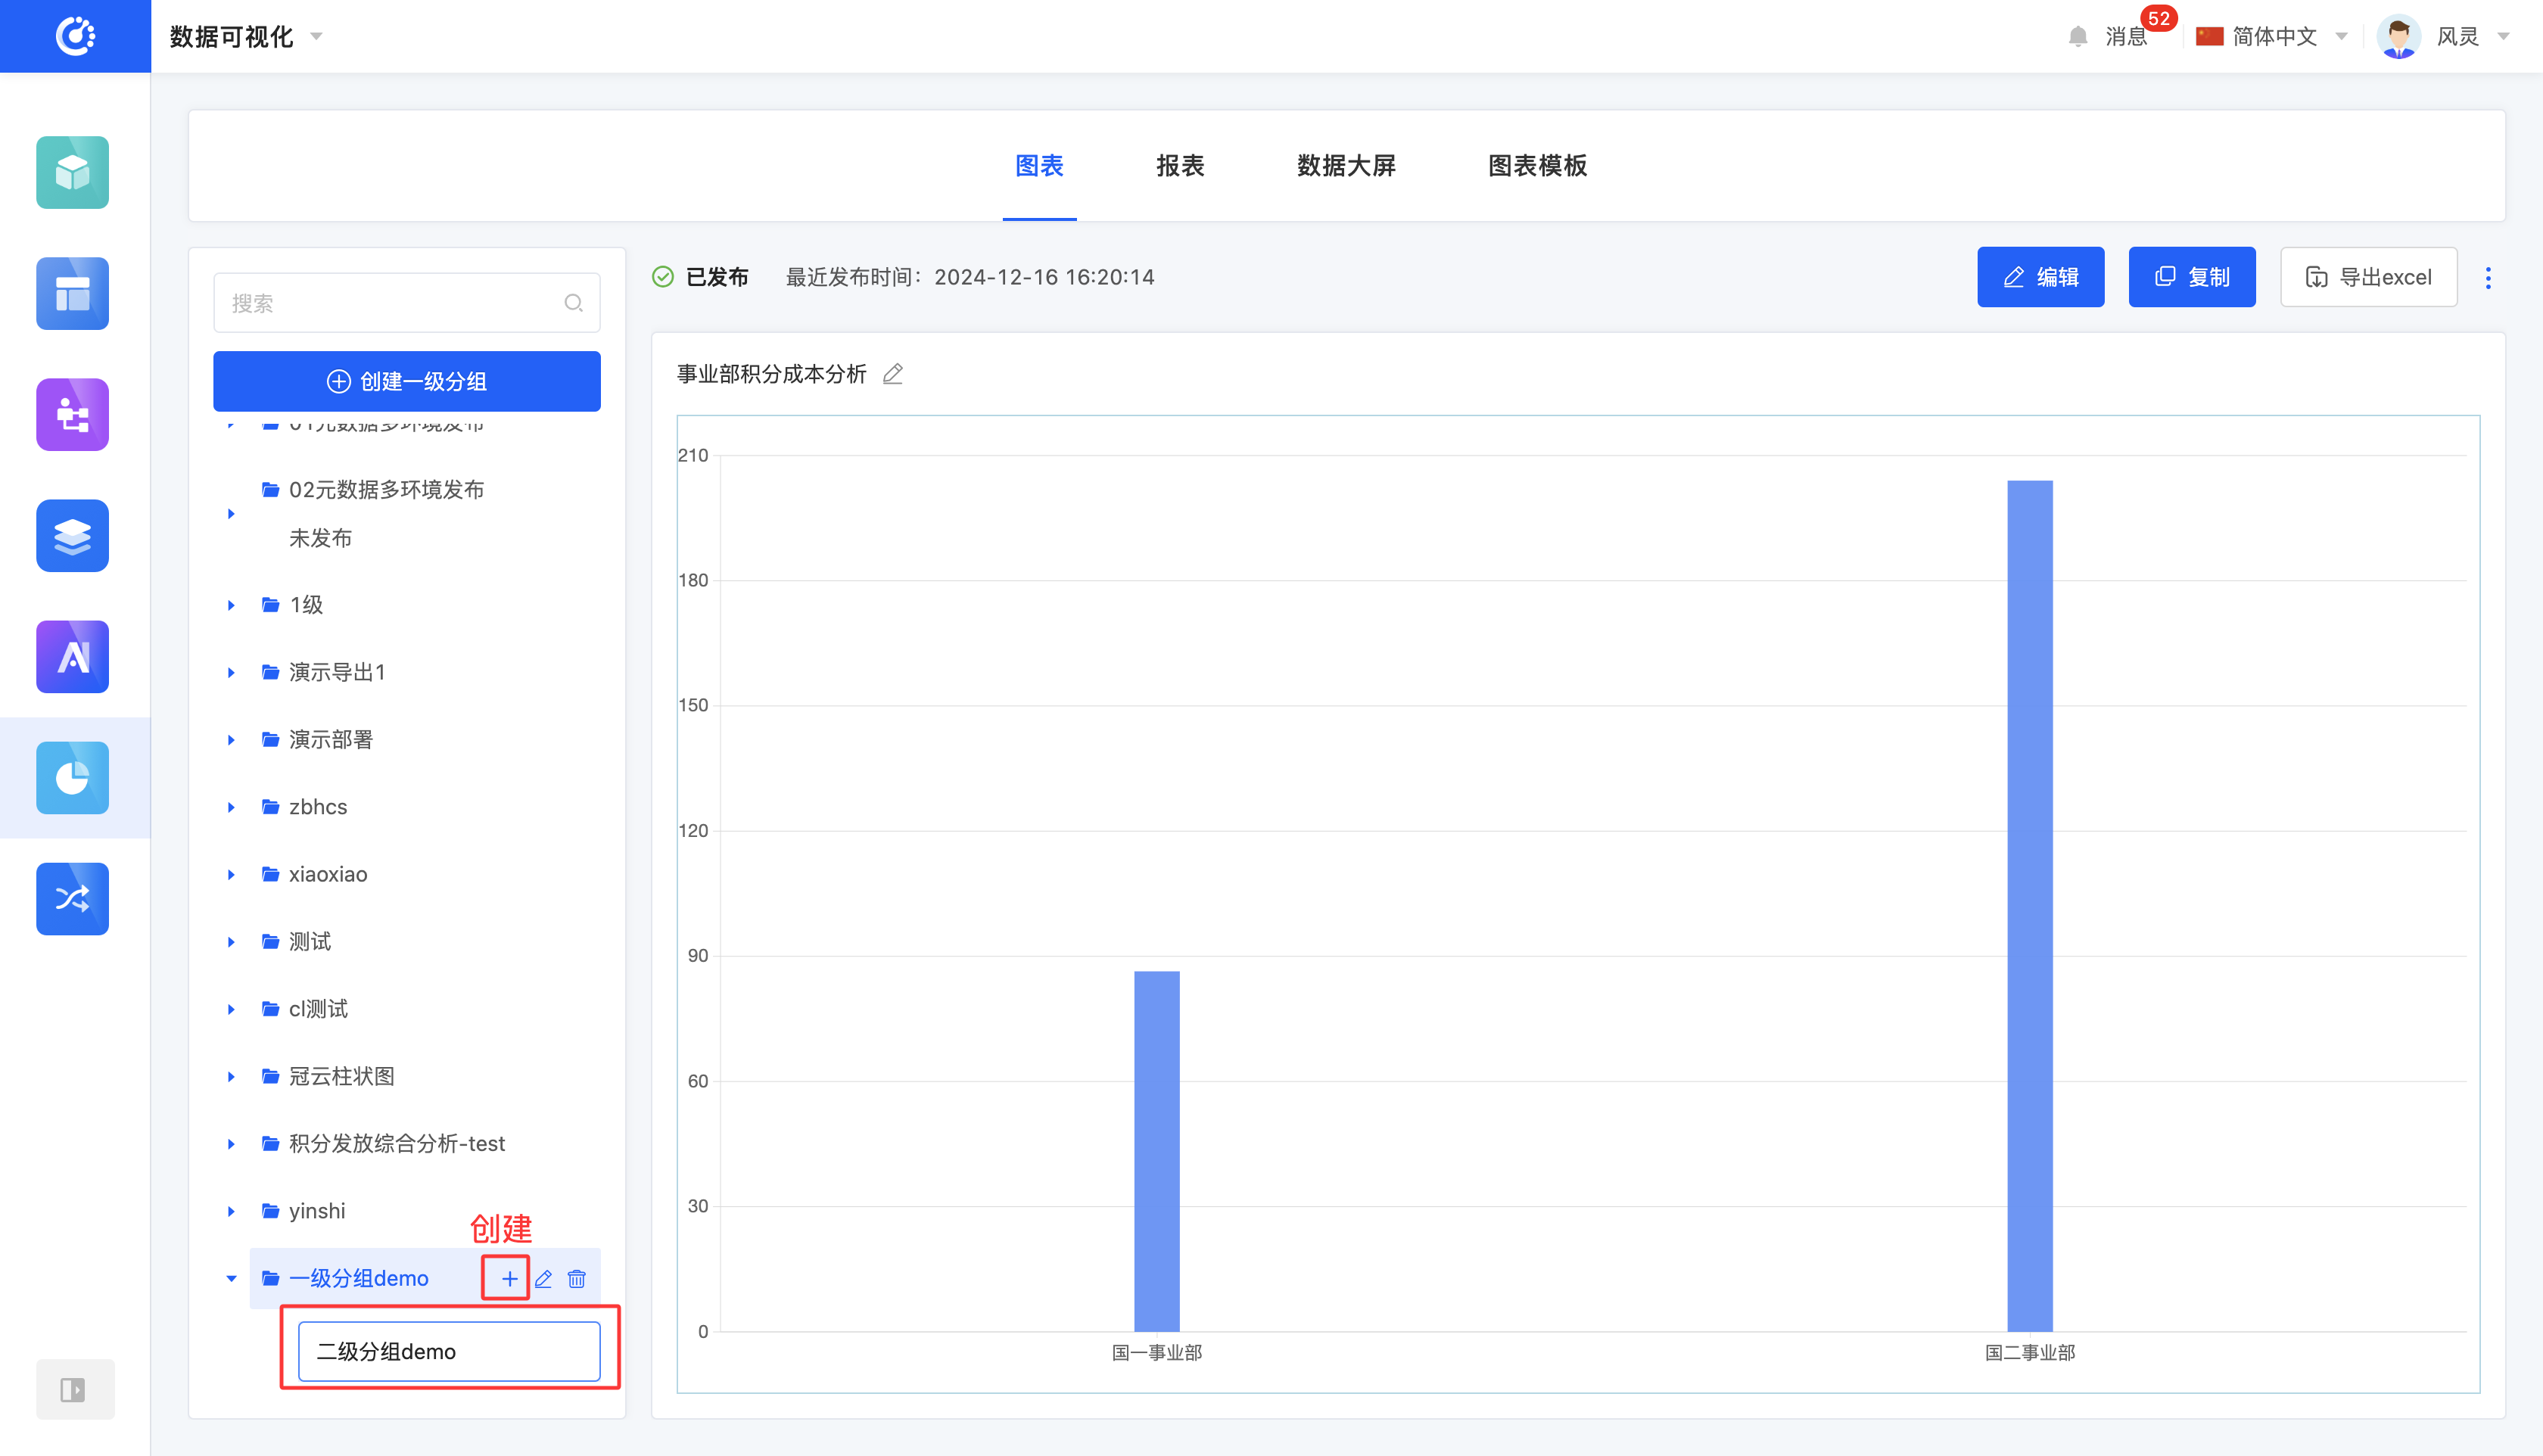
- Create a Group: First, click the "Create First-Level Group" button and enter the first-level group name to complete the creation of the first-level group. Then, below the first-level group, click the "Create" icon and enter the second-level group name to successfully create the second-level group. At this point, the group creation is completed.
Note
- First-level group names are not allowed to be repeated, and first-level group names and second-level group names are not allowed to be repeated.
- Second-level group names under the same first-level group are not allowed to be repeated.
- Second-level group names under different first-level groups are allowed to be repeated.
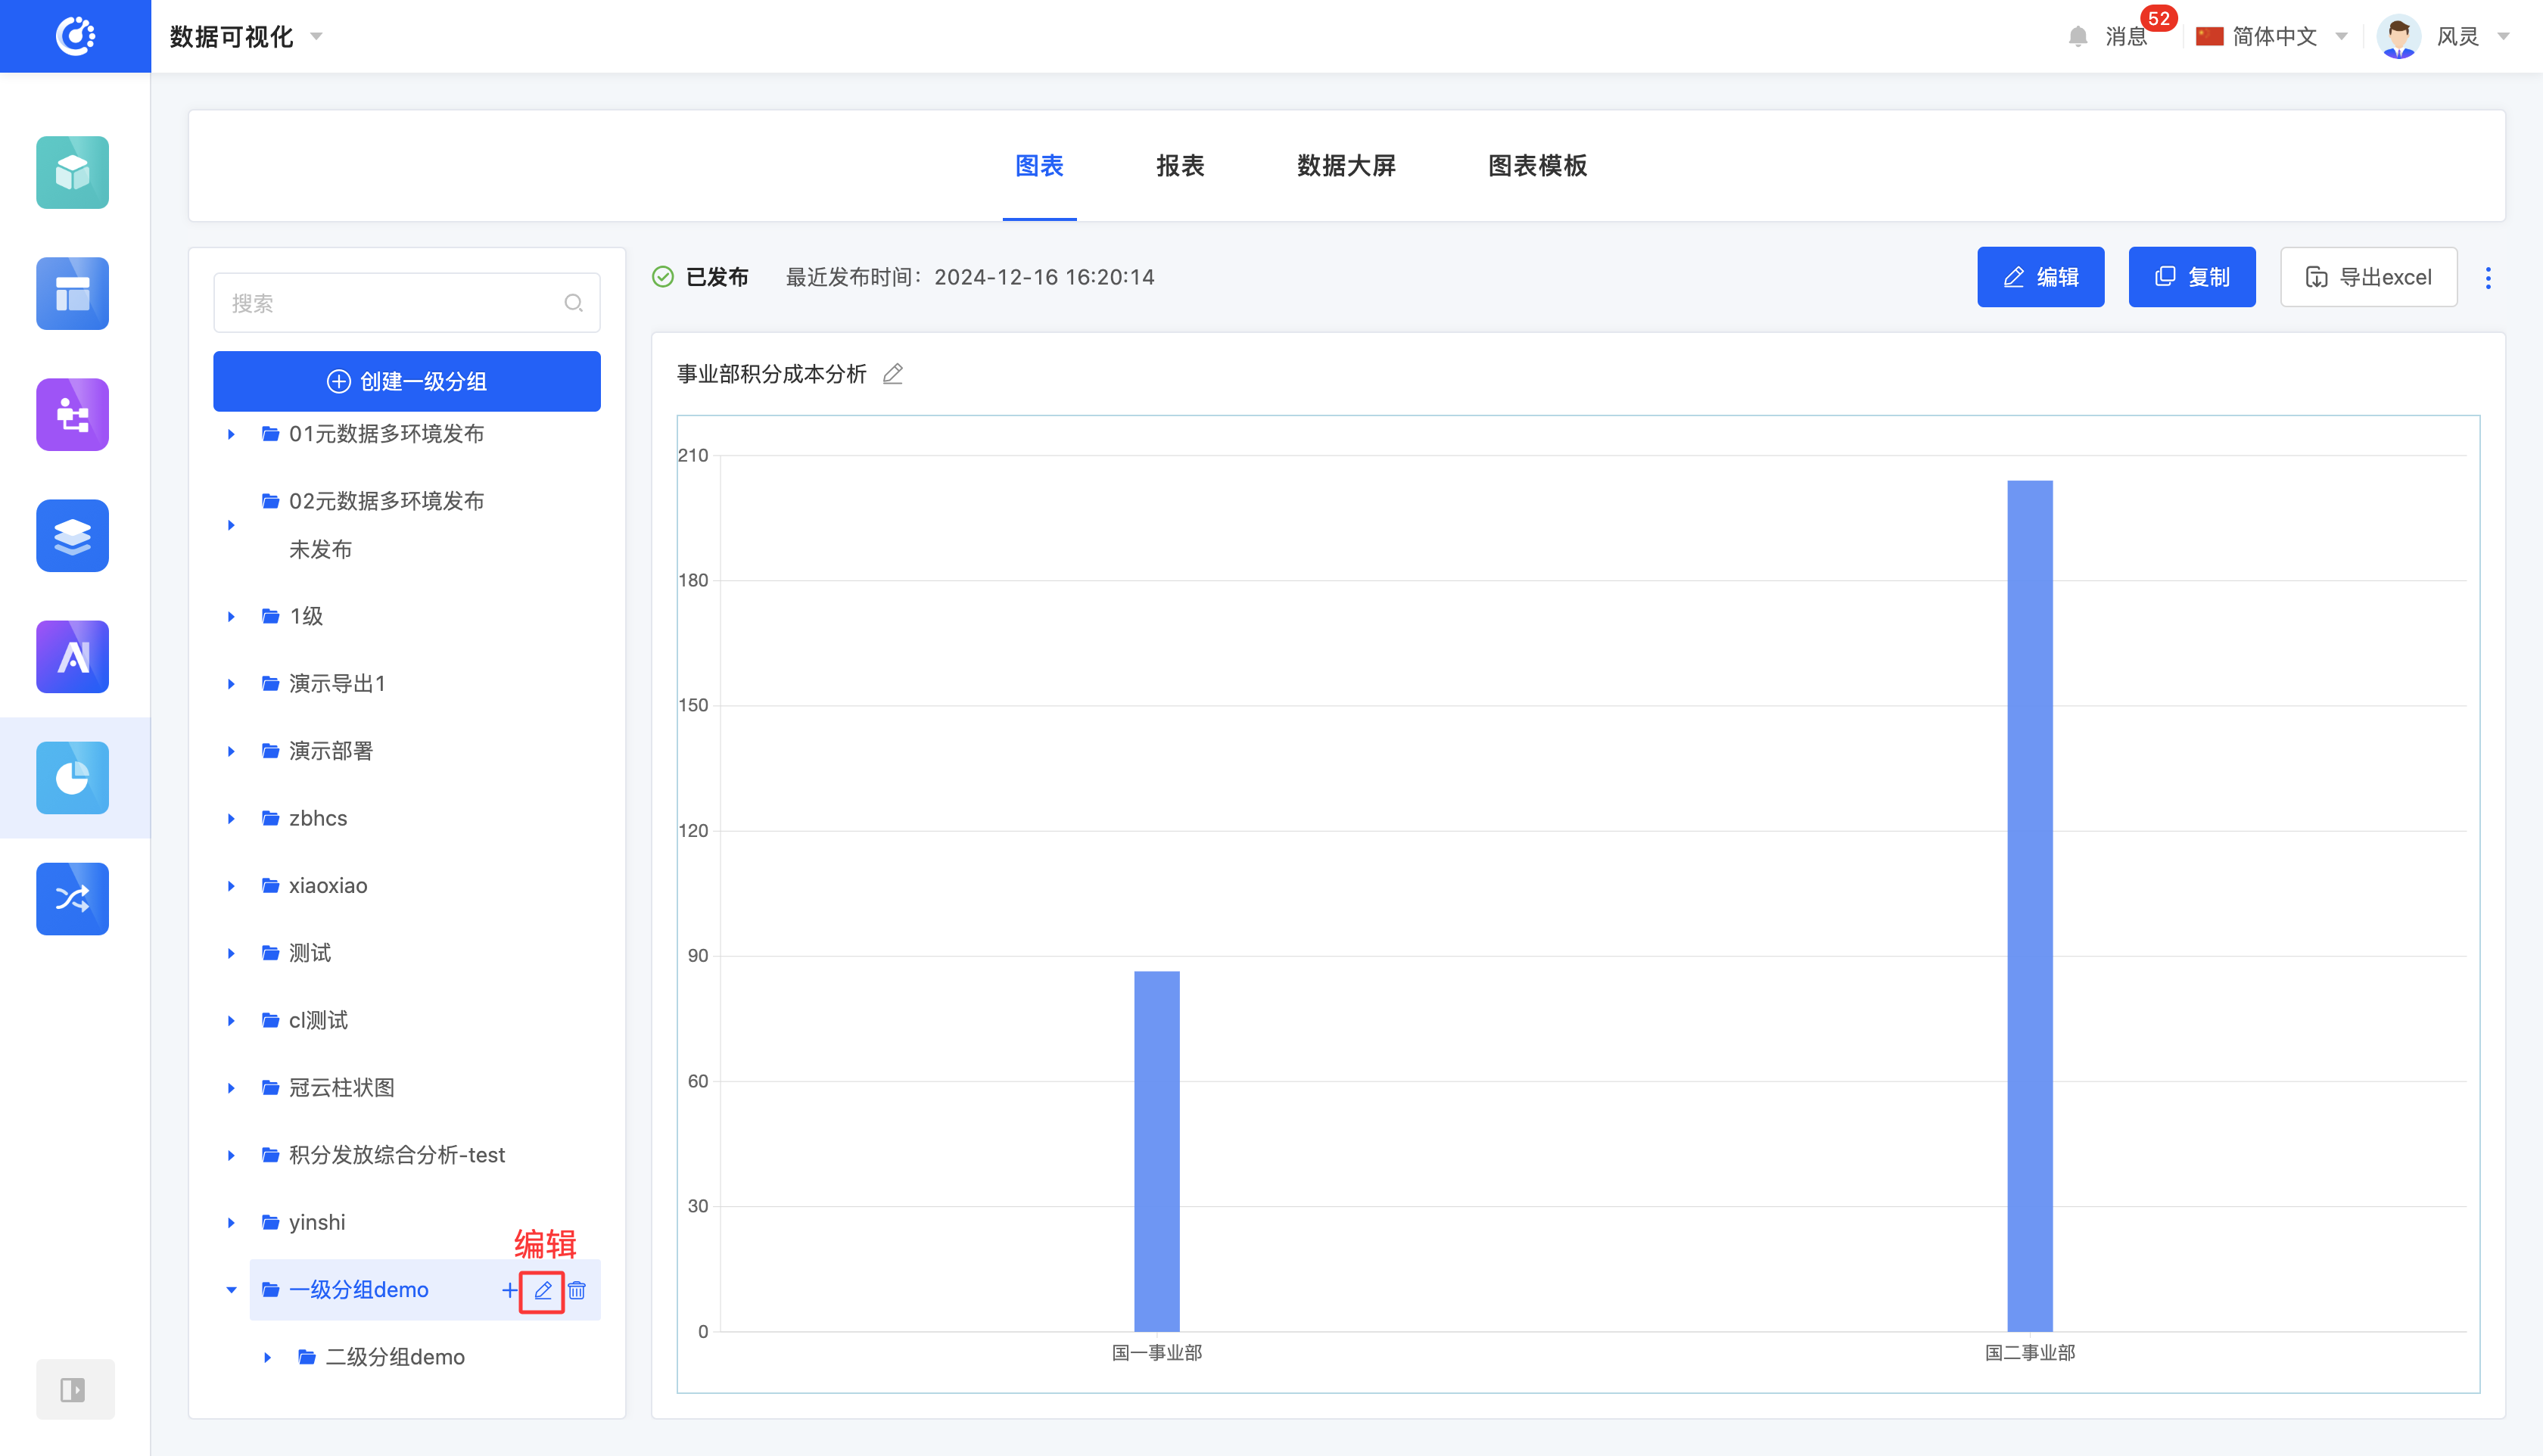
- Edit Group Name: Move the mouse over the group to be modified, click the "Edit" icon, and then you can modify the group name.
- Modify Group Position: Drag the group to change its position.
Note
- You can only drag groups at the same level. You cannot change a first-level group into a second-level group or vice versa. Similarly, a created chart is not allowed to be changed into a group.
- You can move a second-level group under another first-level group.
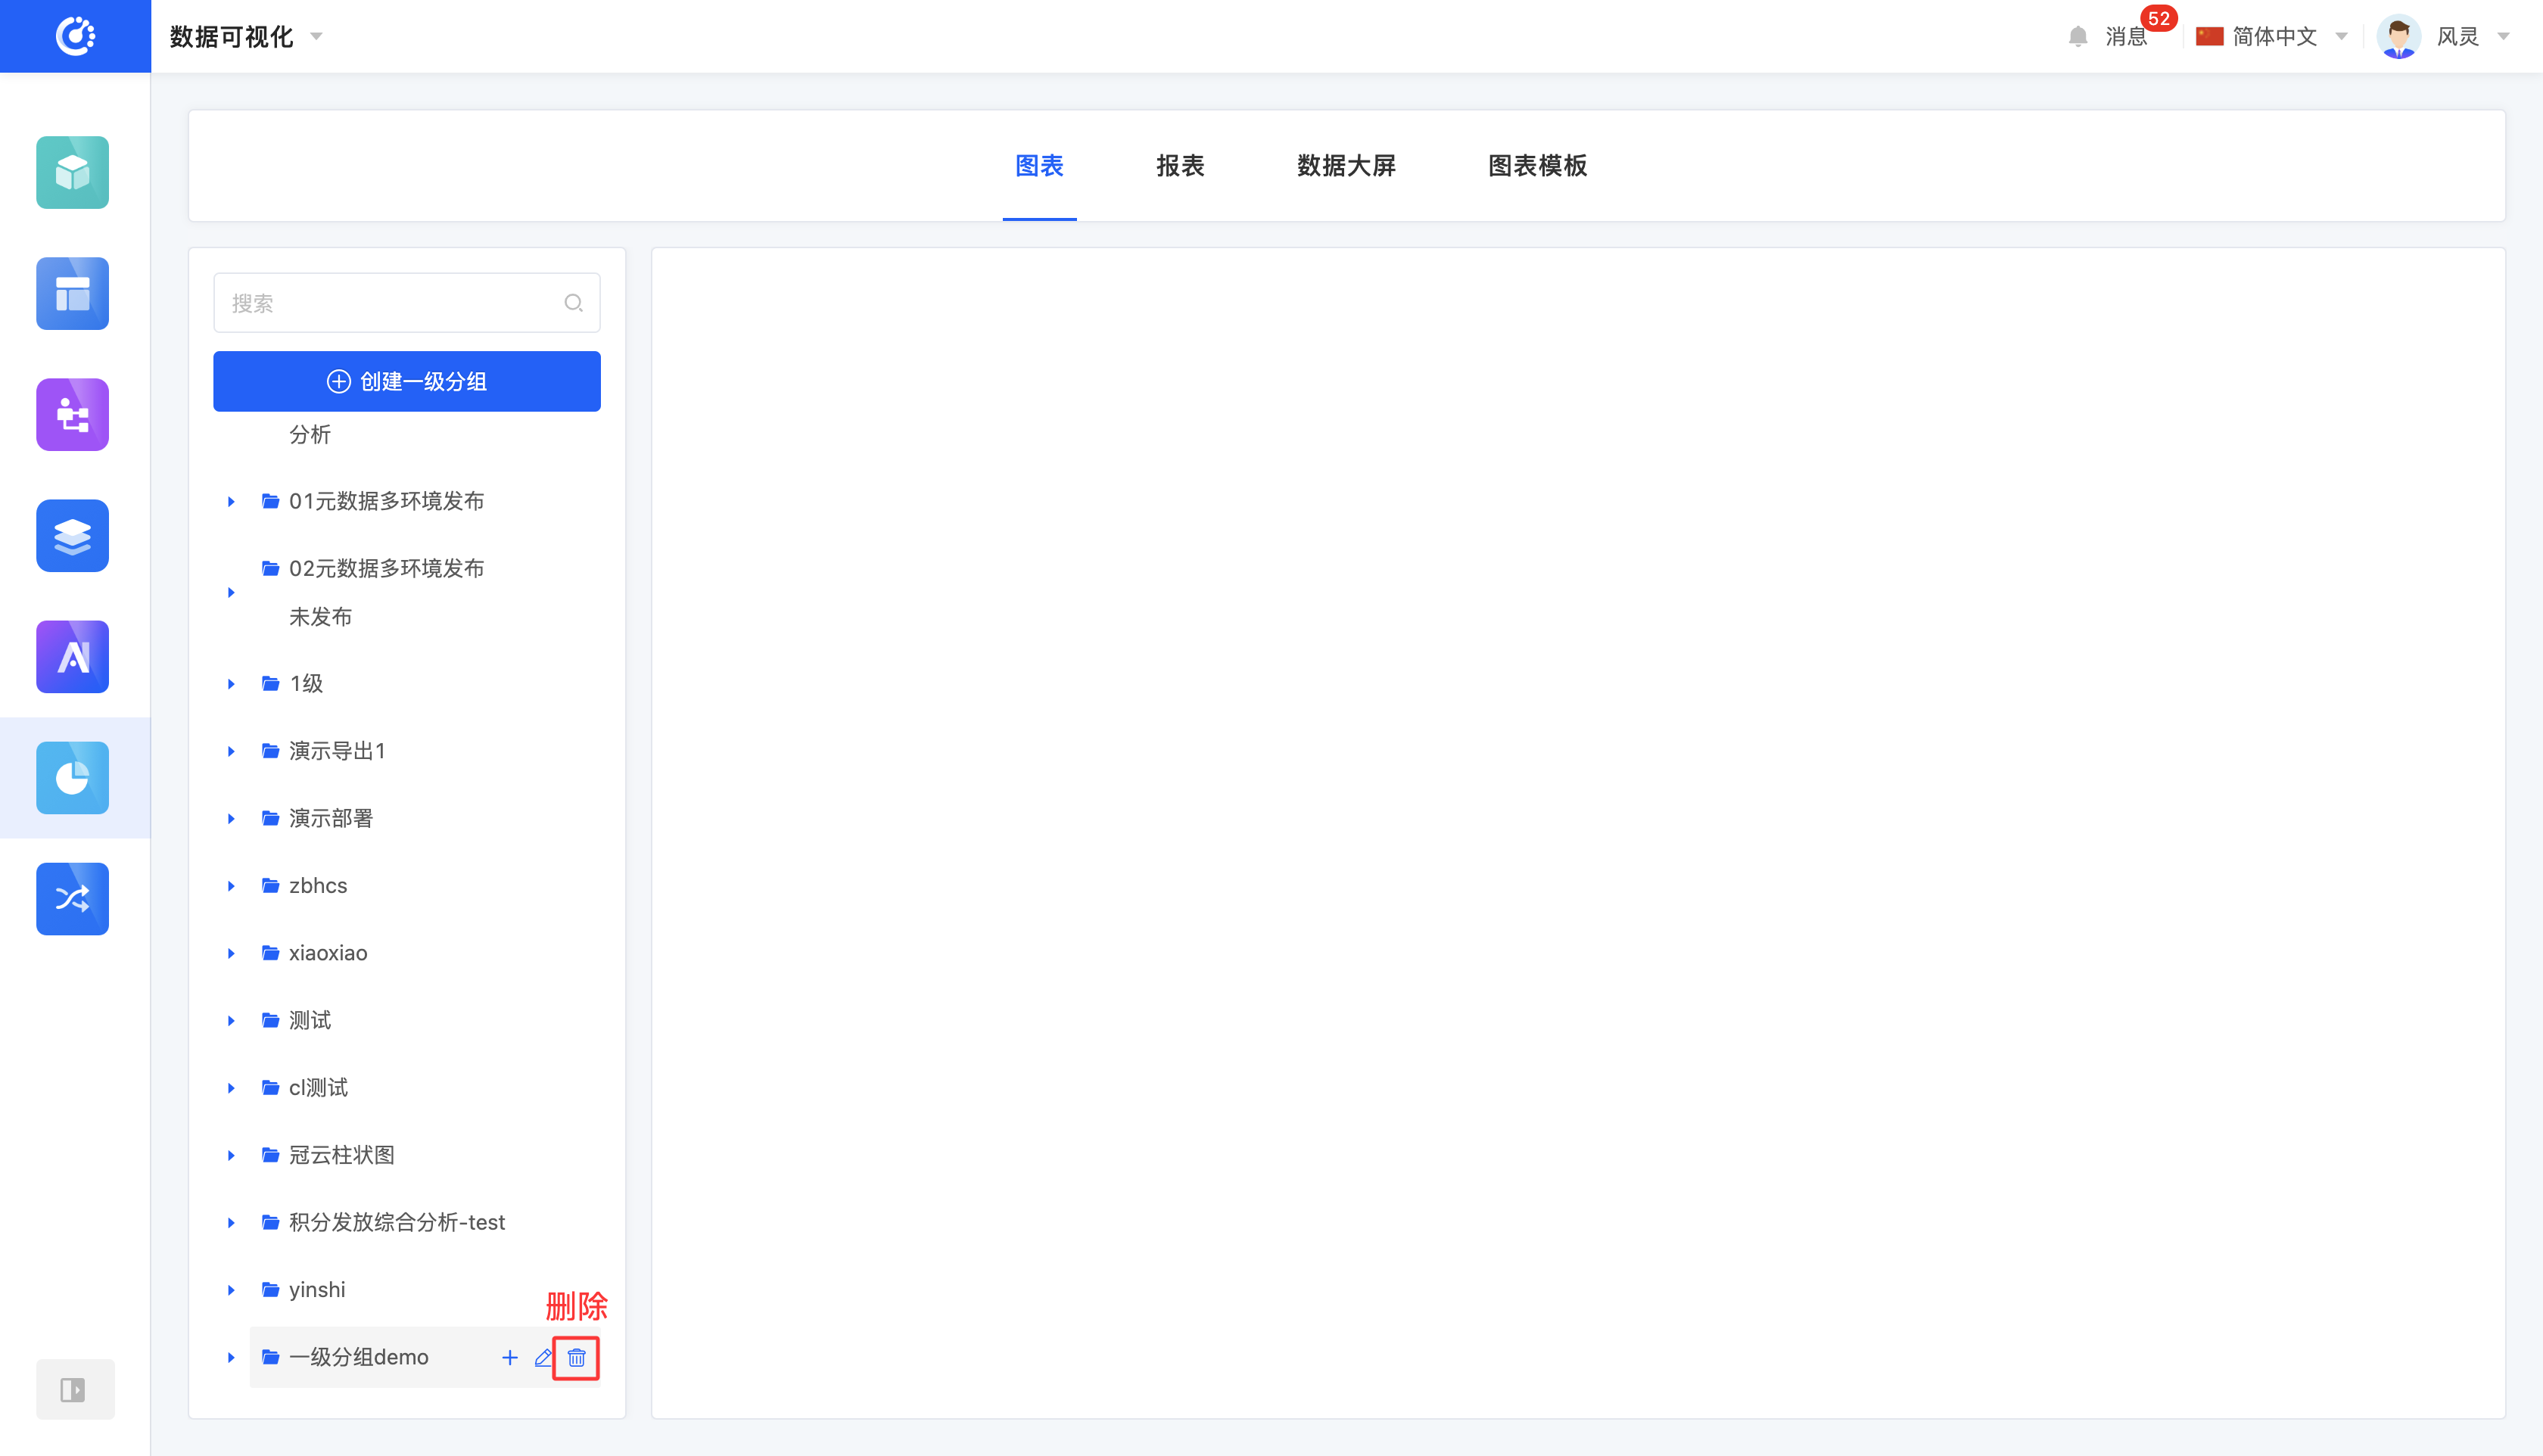
- Delete a Group: Move the mouse over the group to be deleted, click the "Delete" icon, and then you can delete the group.
Note
- When deleting a first-level group, its included second-level groups will also be deleted.
- You cannot successfully delete a group when there are charts under it.
III. Add a Chart
1. Function Introduction
Oinone's data visualization provides two ways to create charts:
- Create a chart in the second-level chart group.
- Create a chart in a report.
When creating a chart, you need to edit the basic chart information, including the chart title, data source type, and method. There are four types of data sources:
- When selecting model fields, you need to select an existing model.
- When selecting an integrated application, you need to select an application and an API.
- When selecting a database, you need to select a database and an API.
- When selecting a file set, you need to select a file set and a file.
2. Operation Method
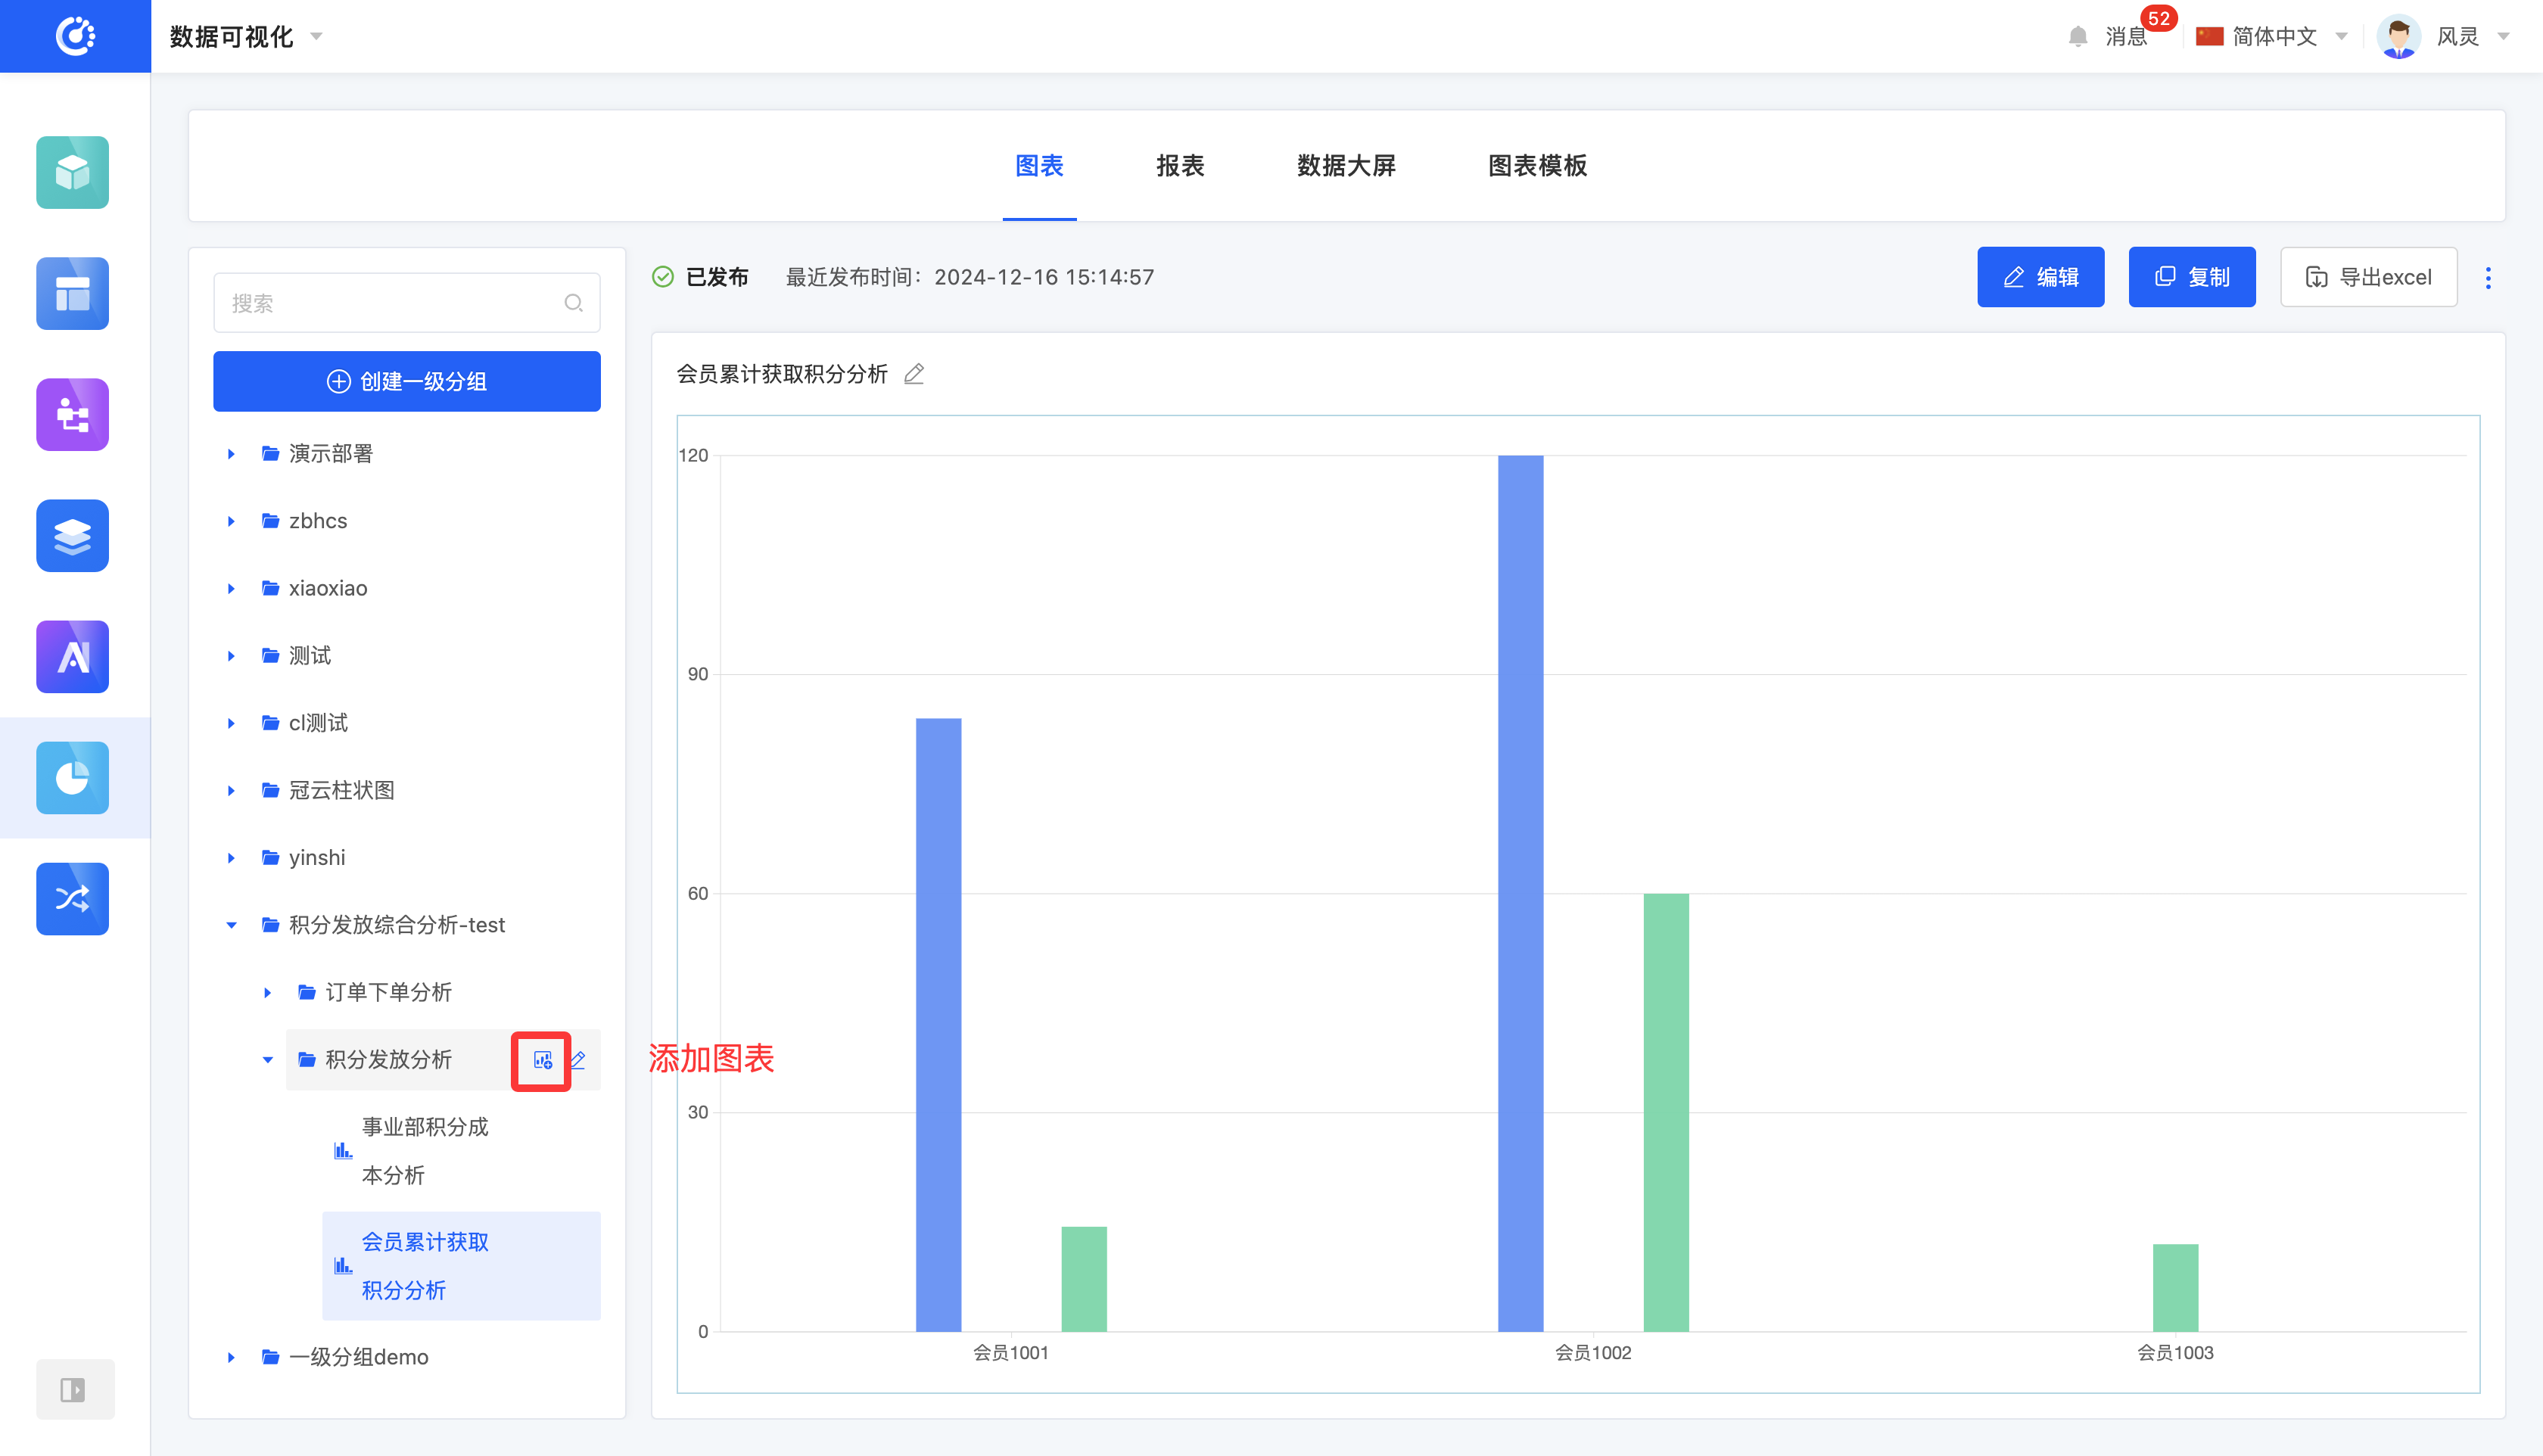
- Click the "Create Chart" icon under the second-level group in the chart list area, enter the chart information, and then you can successfully create the chart.
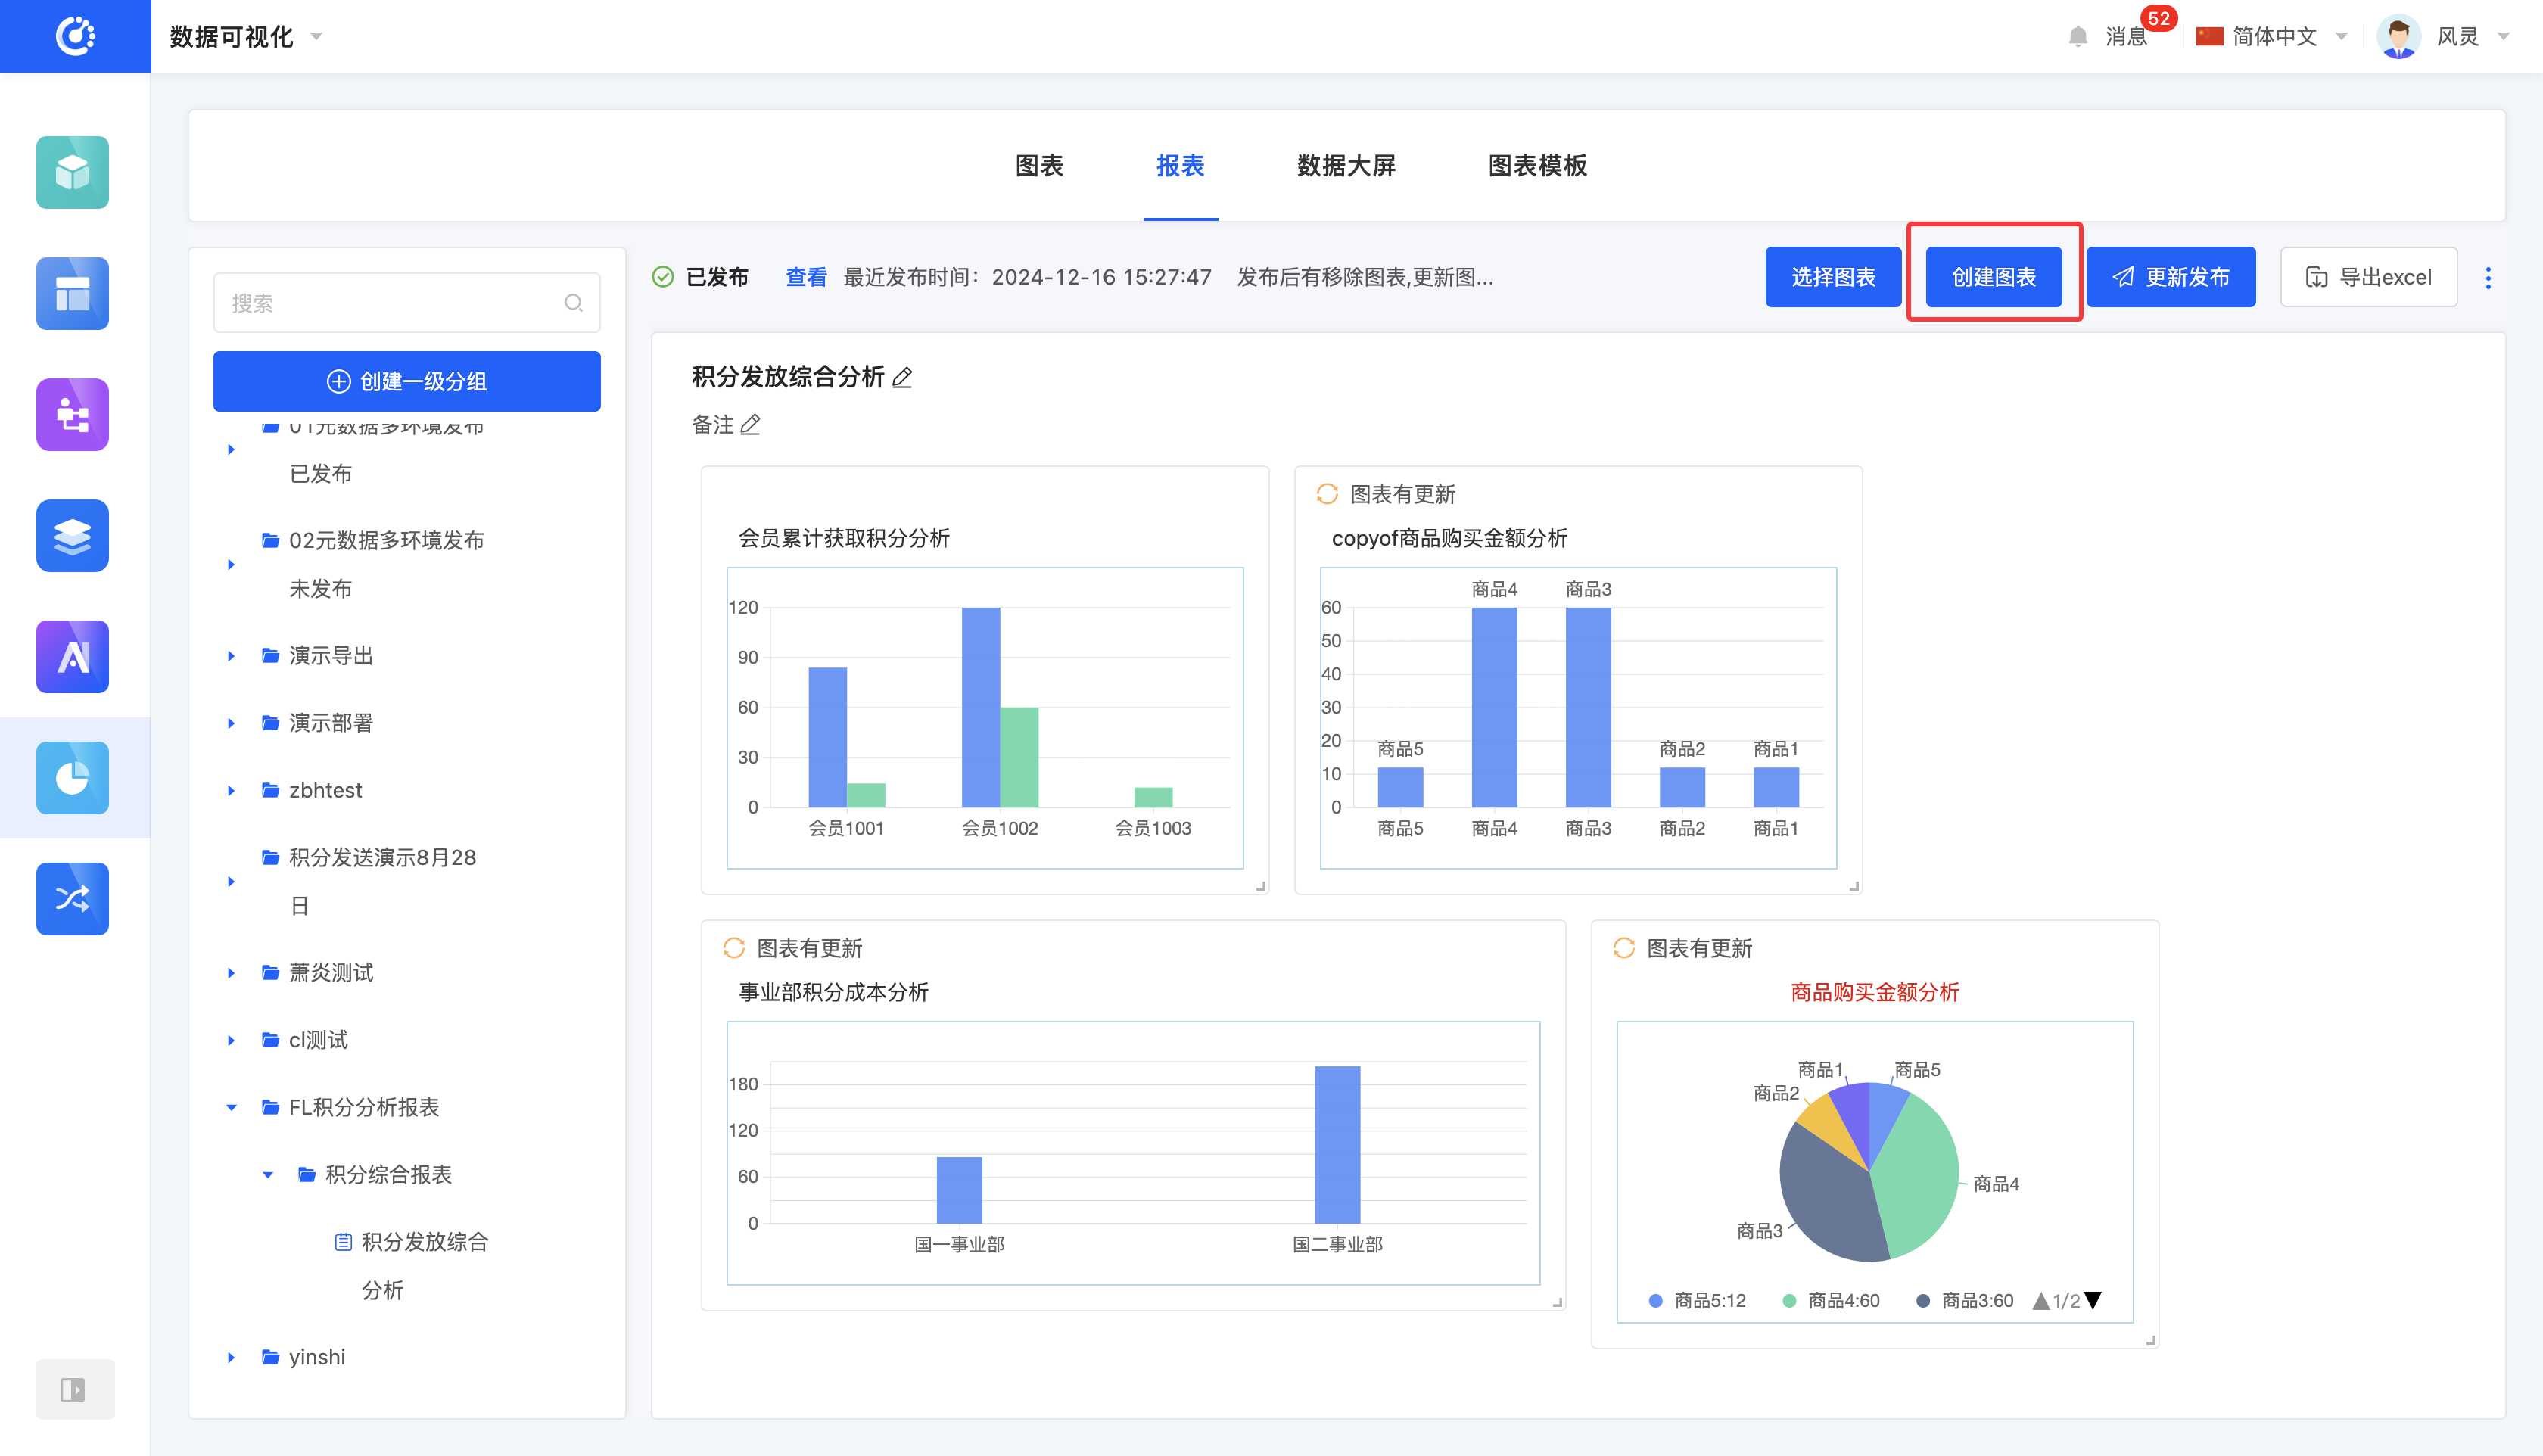
- Click "Create Chart" in a report, enter the information, and then you can successfully create the chart.
Note
You need to select a group here.
- If there are no charts in the report yet, you can select any referable group in the chart.
- If there are already charts in the report, you can only select the second-level group under the first-level group where the charts are located.
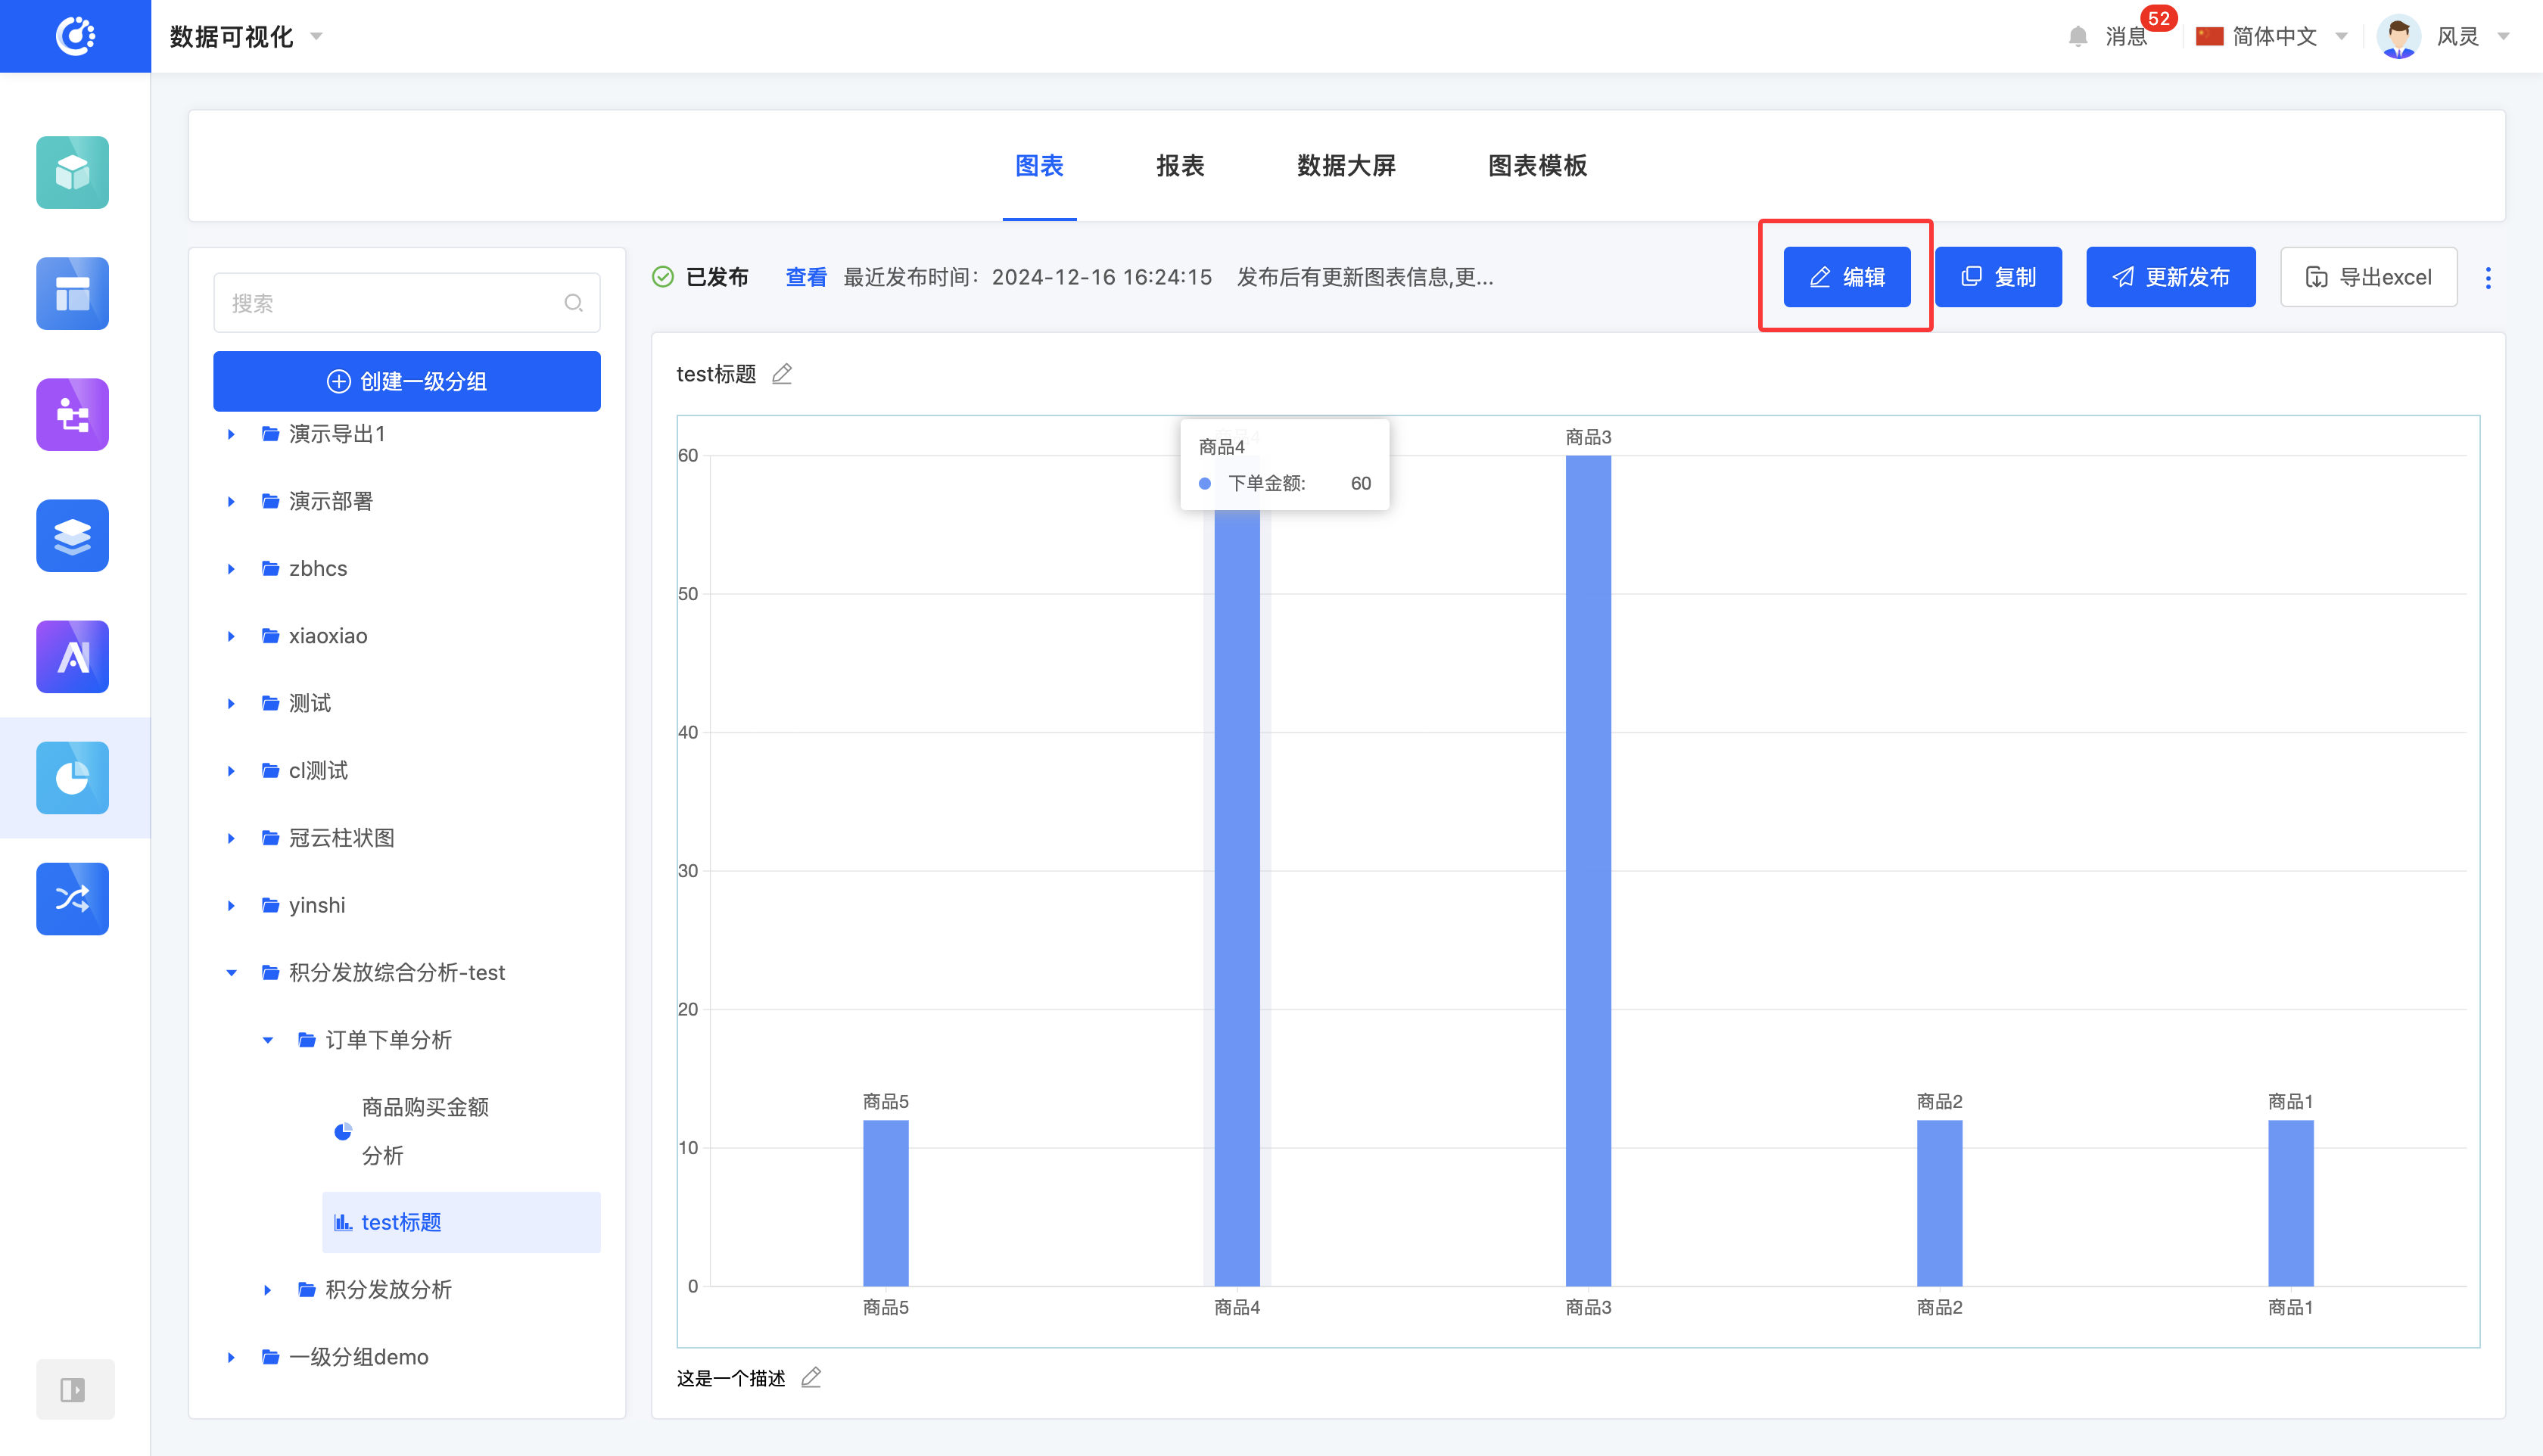
IV. Edit a Chart
1. Function Introduction
You can edit charts that are not published or have been published but not hidden. There are three editing scenarios:
- Edit in the list area: You can only edit the title.
- Edit in the chart preview area: You can edit the title, subtitle, and description.
- Edit when designing the chart: You can edit the data source type, method, title, subtitle, and description.
Note
If the title, subtitle, or description is not displayed, you can check whether the display is turned off in the style bar of the chart design. If it is turned off, it cannot be displayed, and similarly, it cannot be edited.
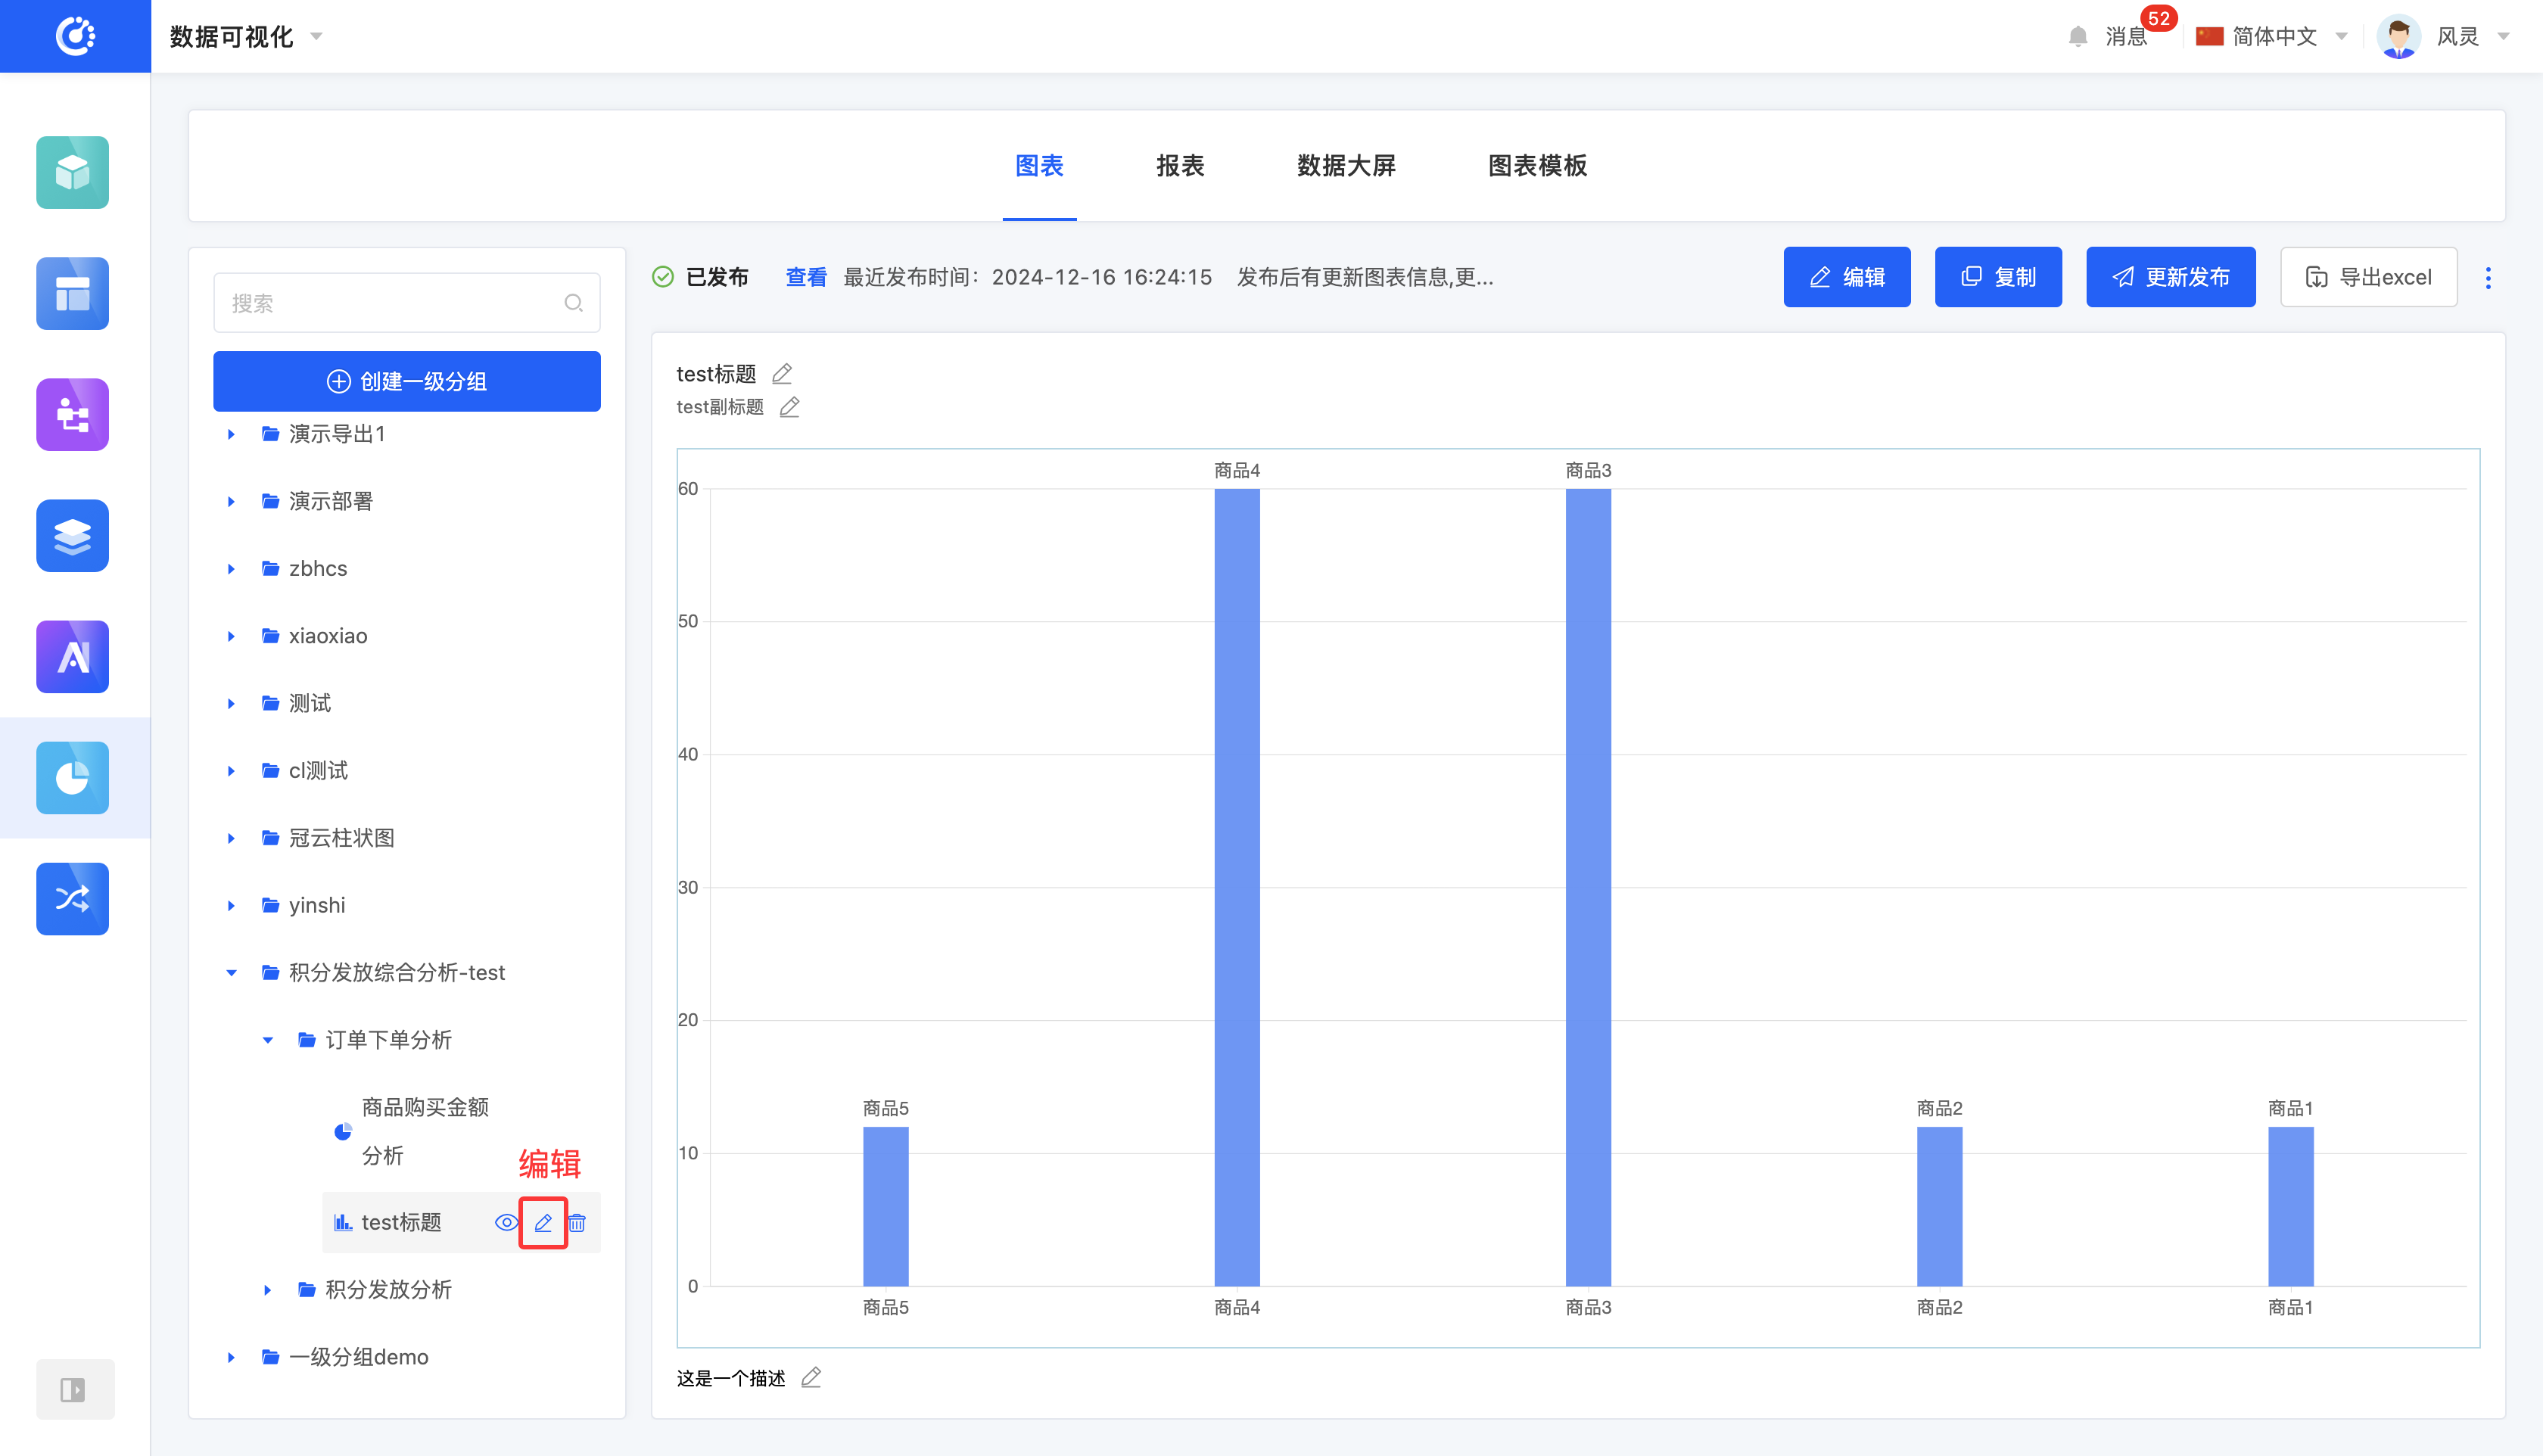
2. Operation Method
- In the list area, click the "Edit" icon, enter the information, and then you can successfully edit the chart.
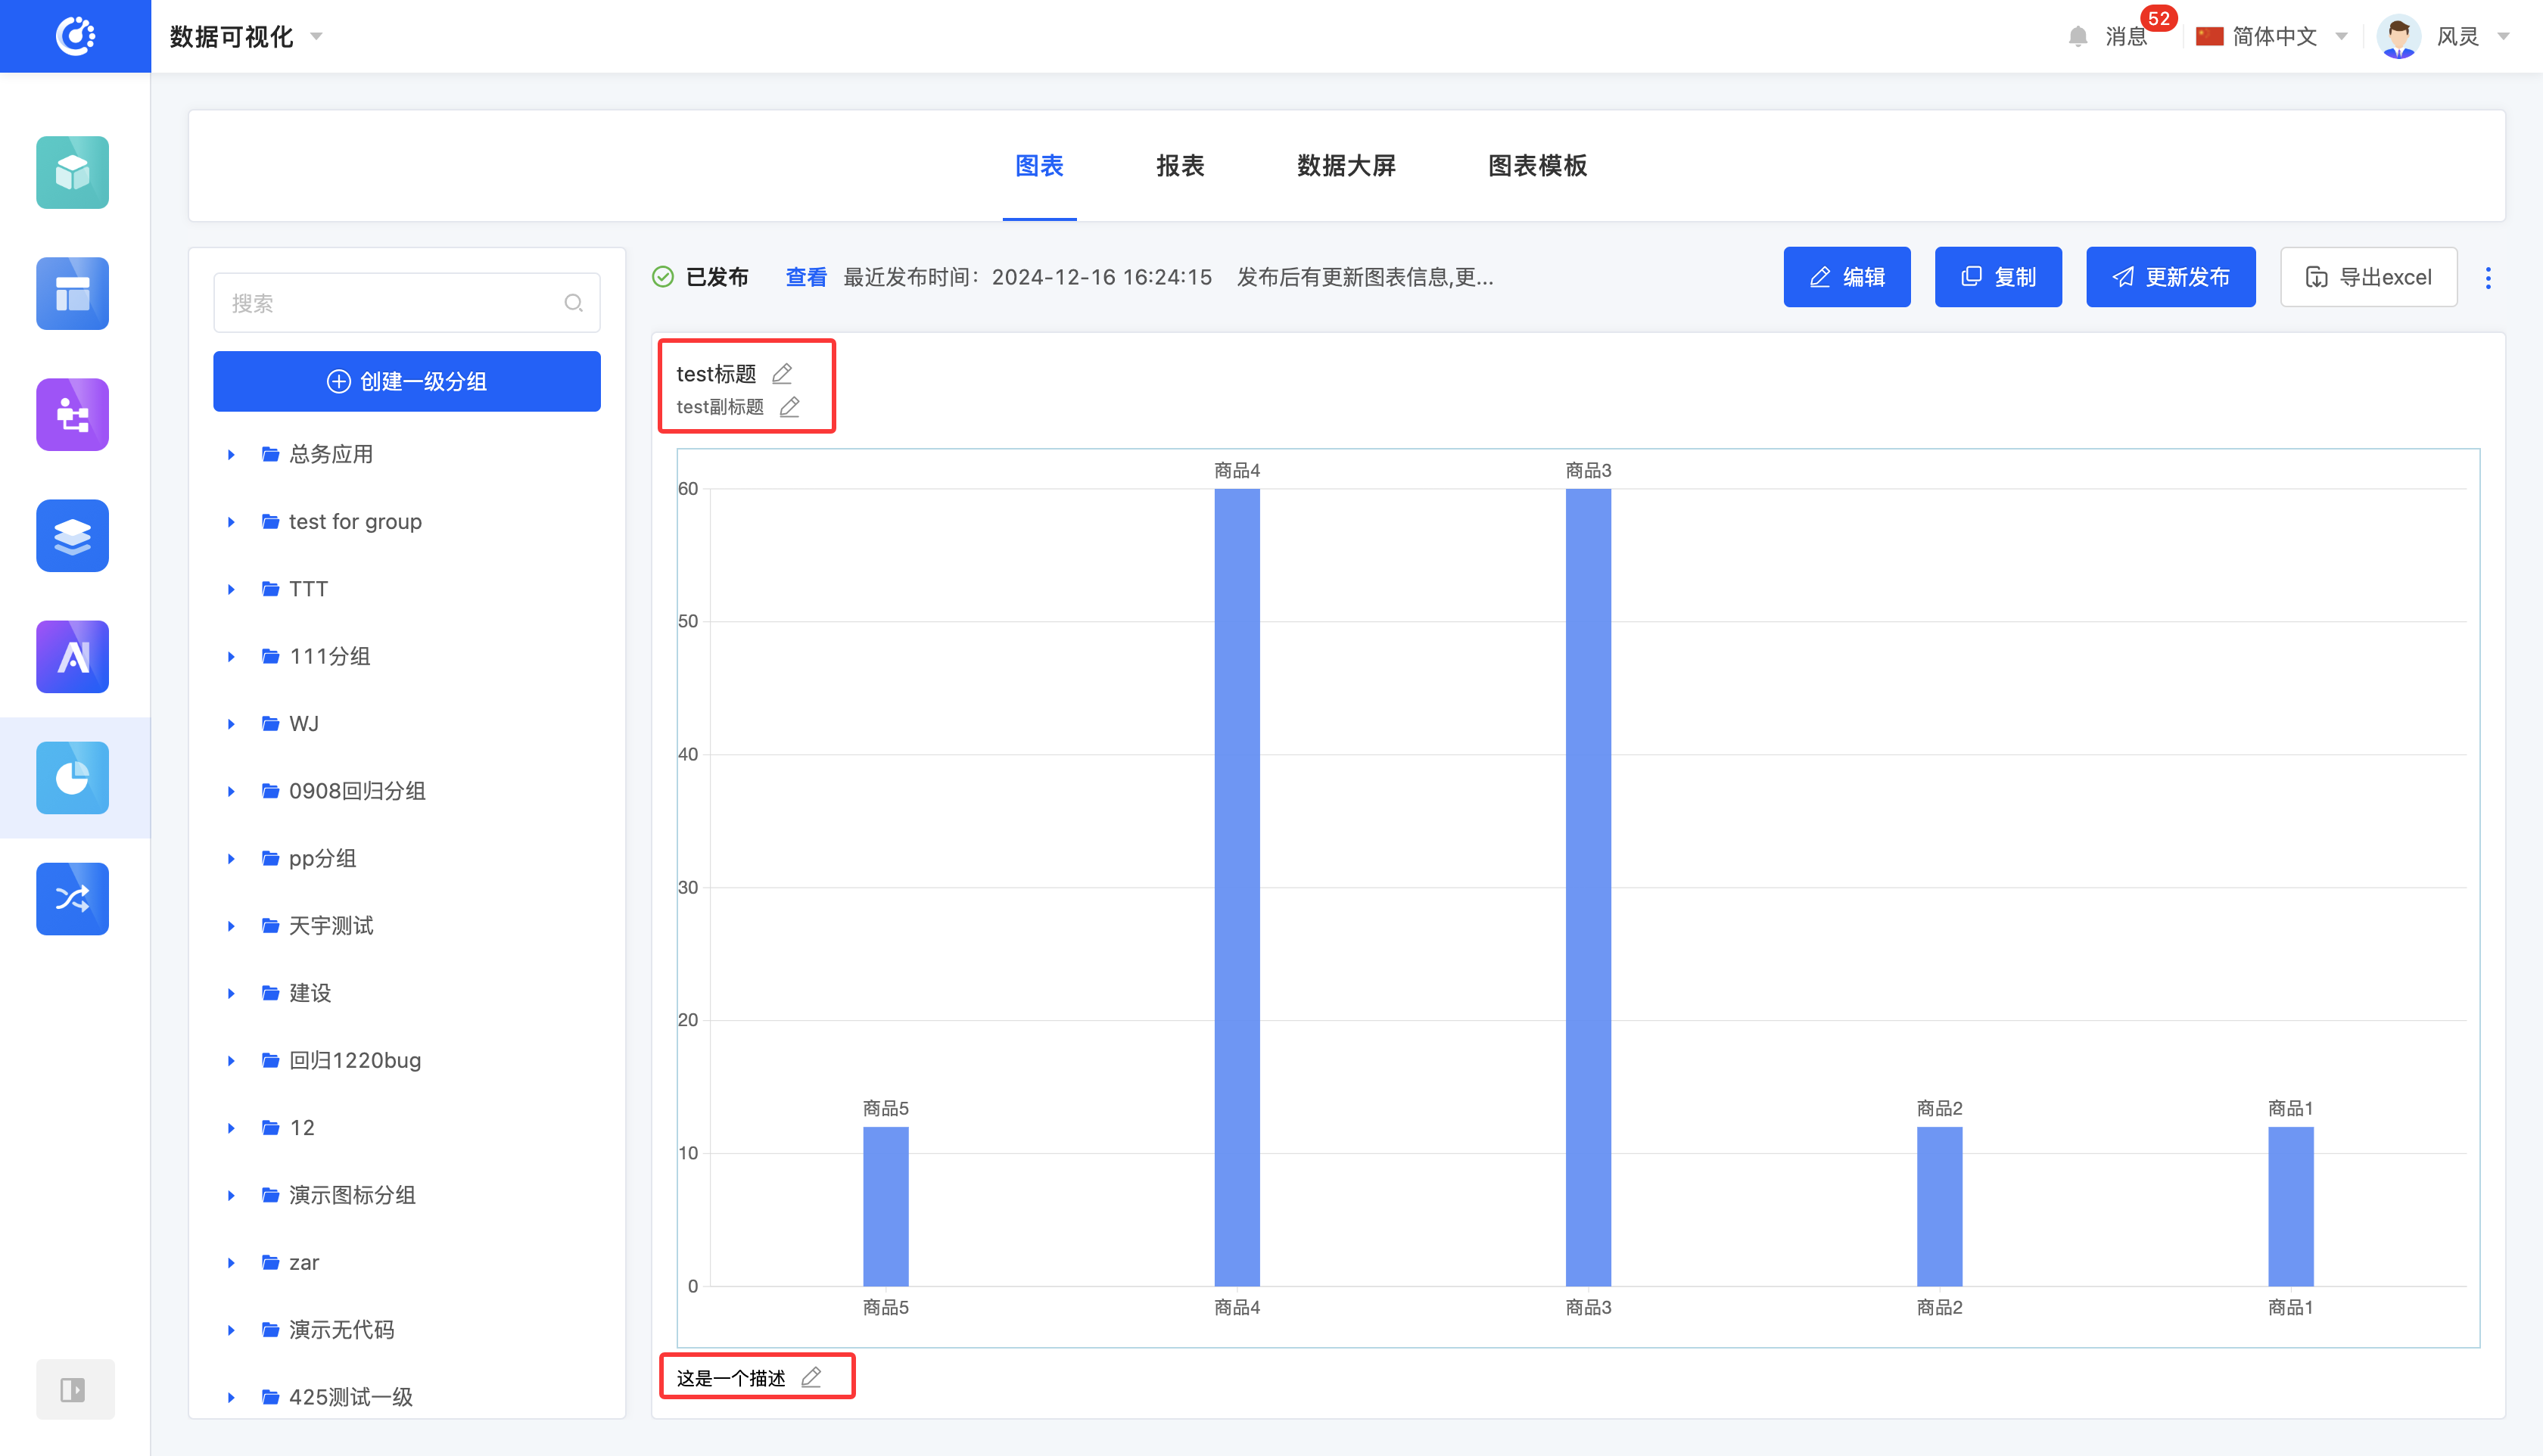
- In the chart preview area, click the title area, subtitle area, description area, or the "Edit" icon, enter the information, and then you can successfully edit the chart.
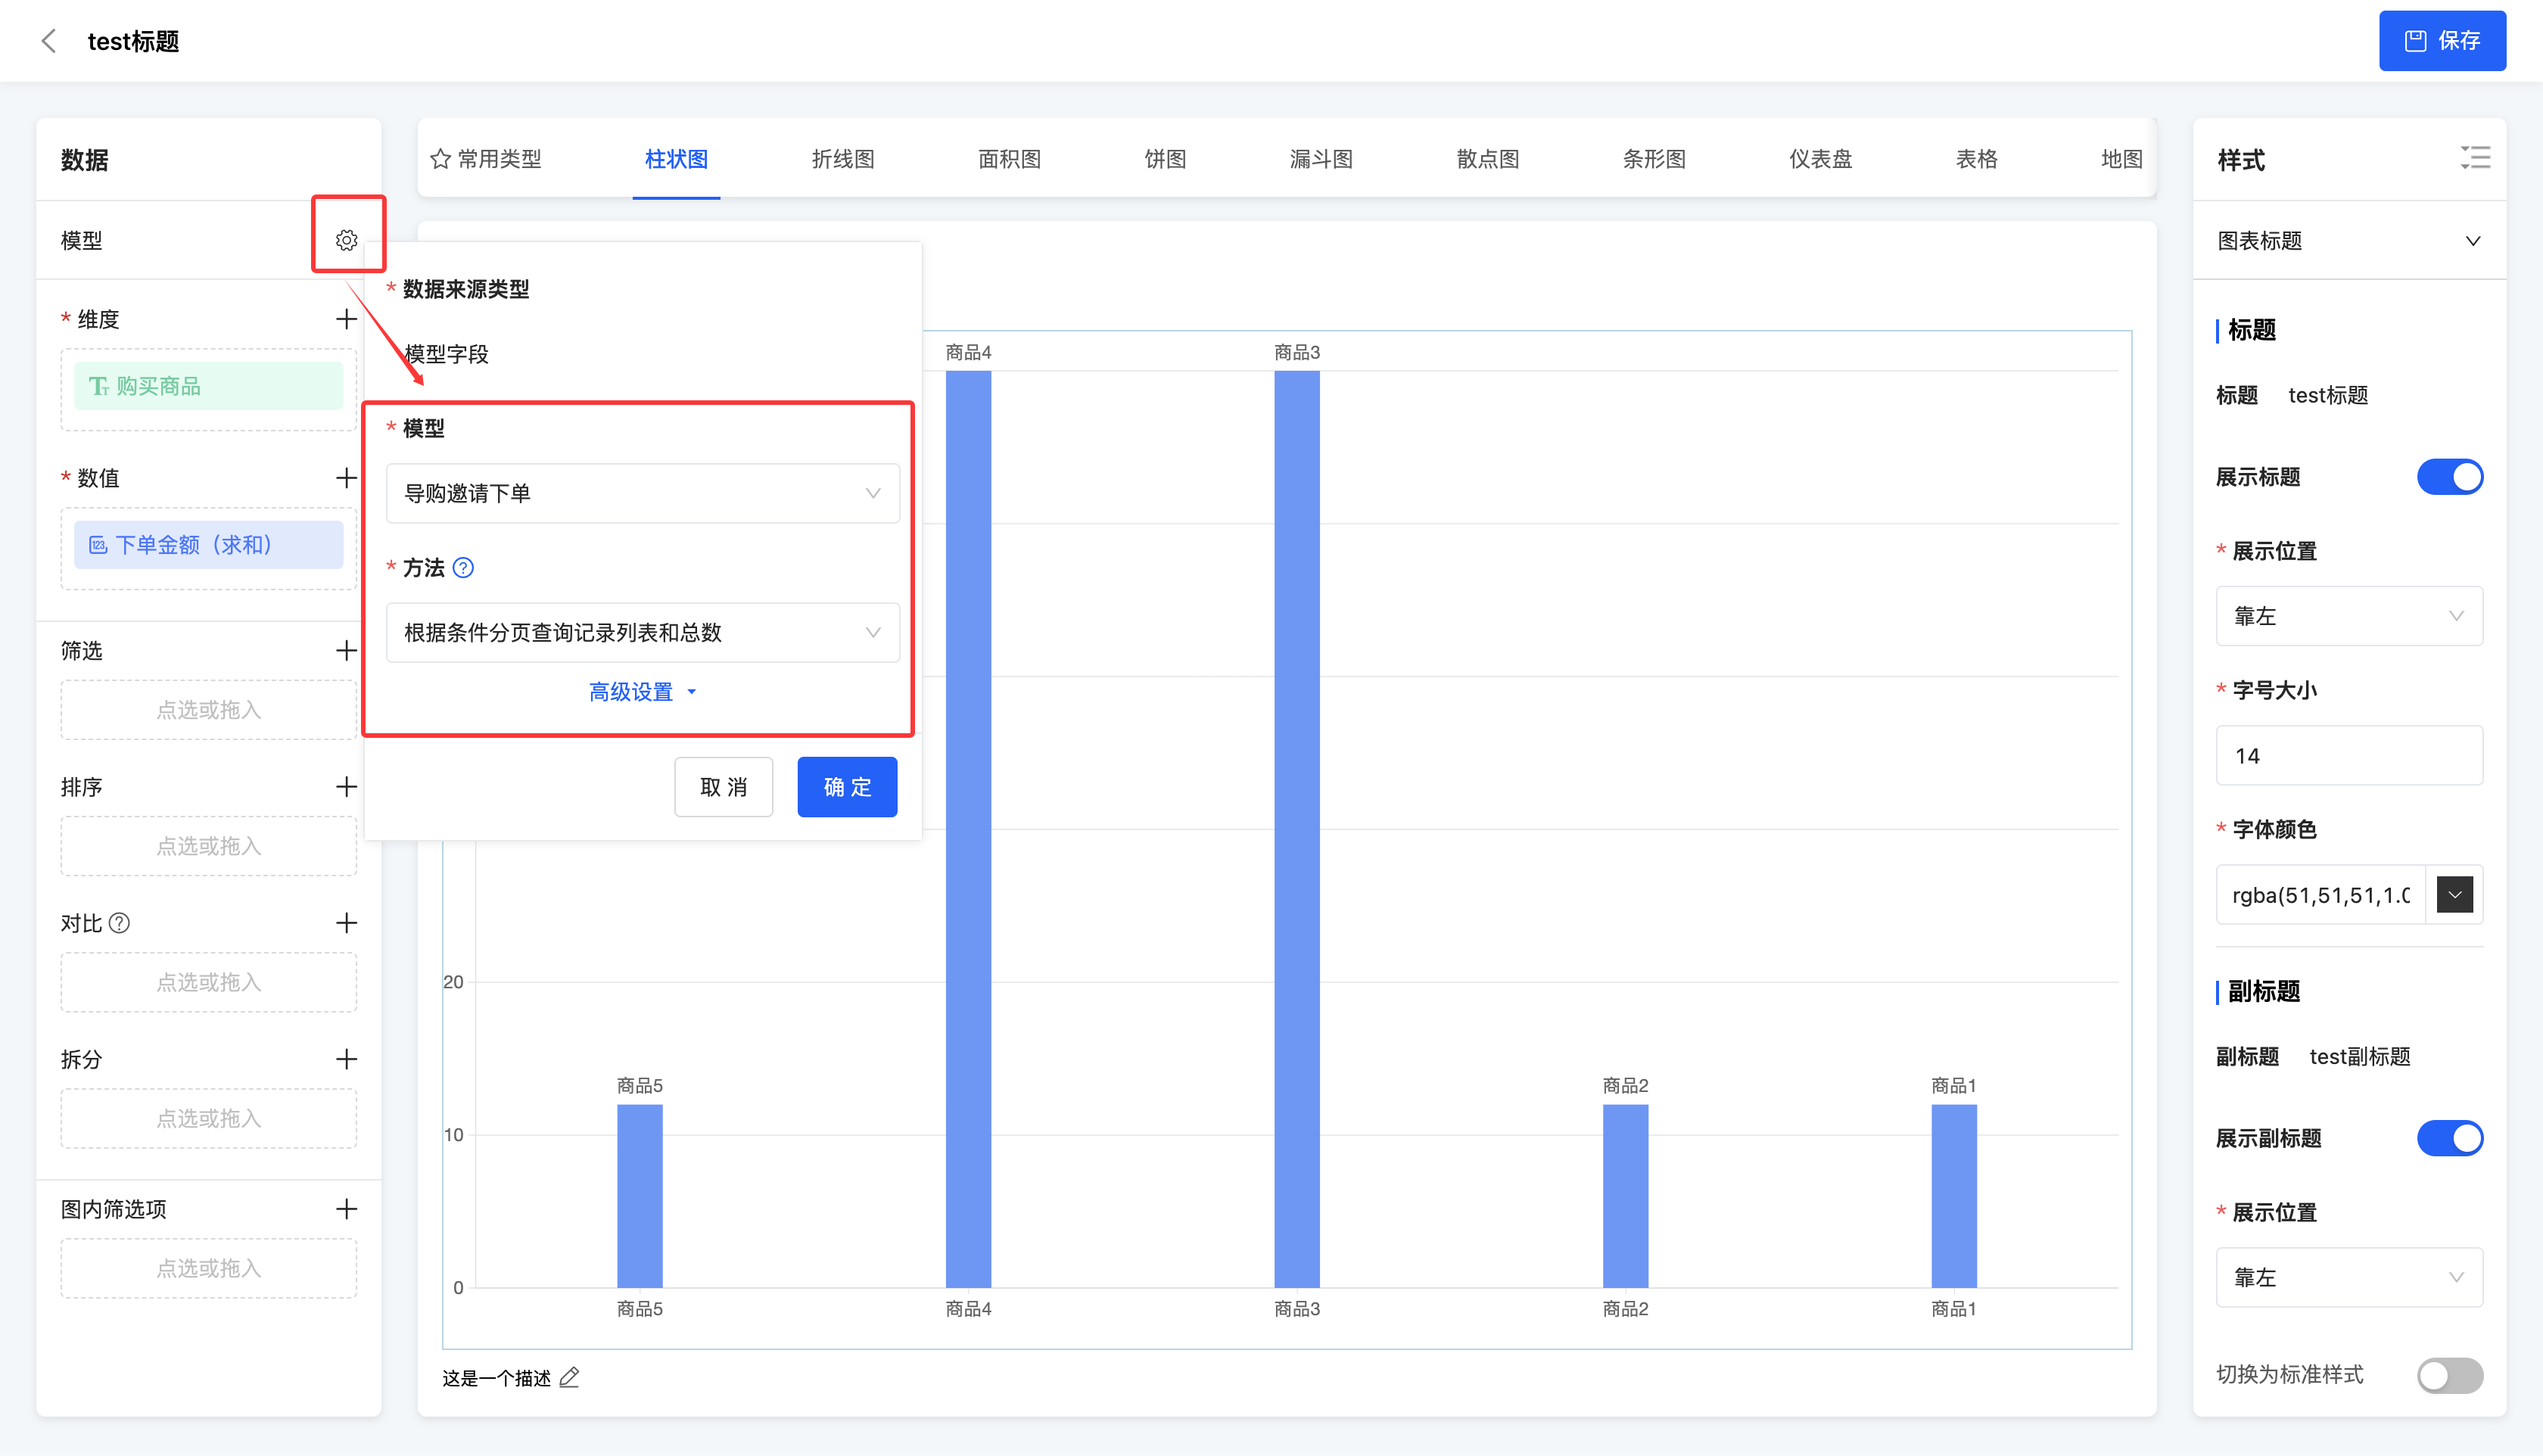
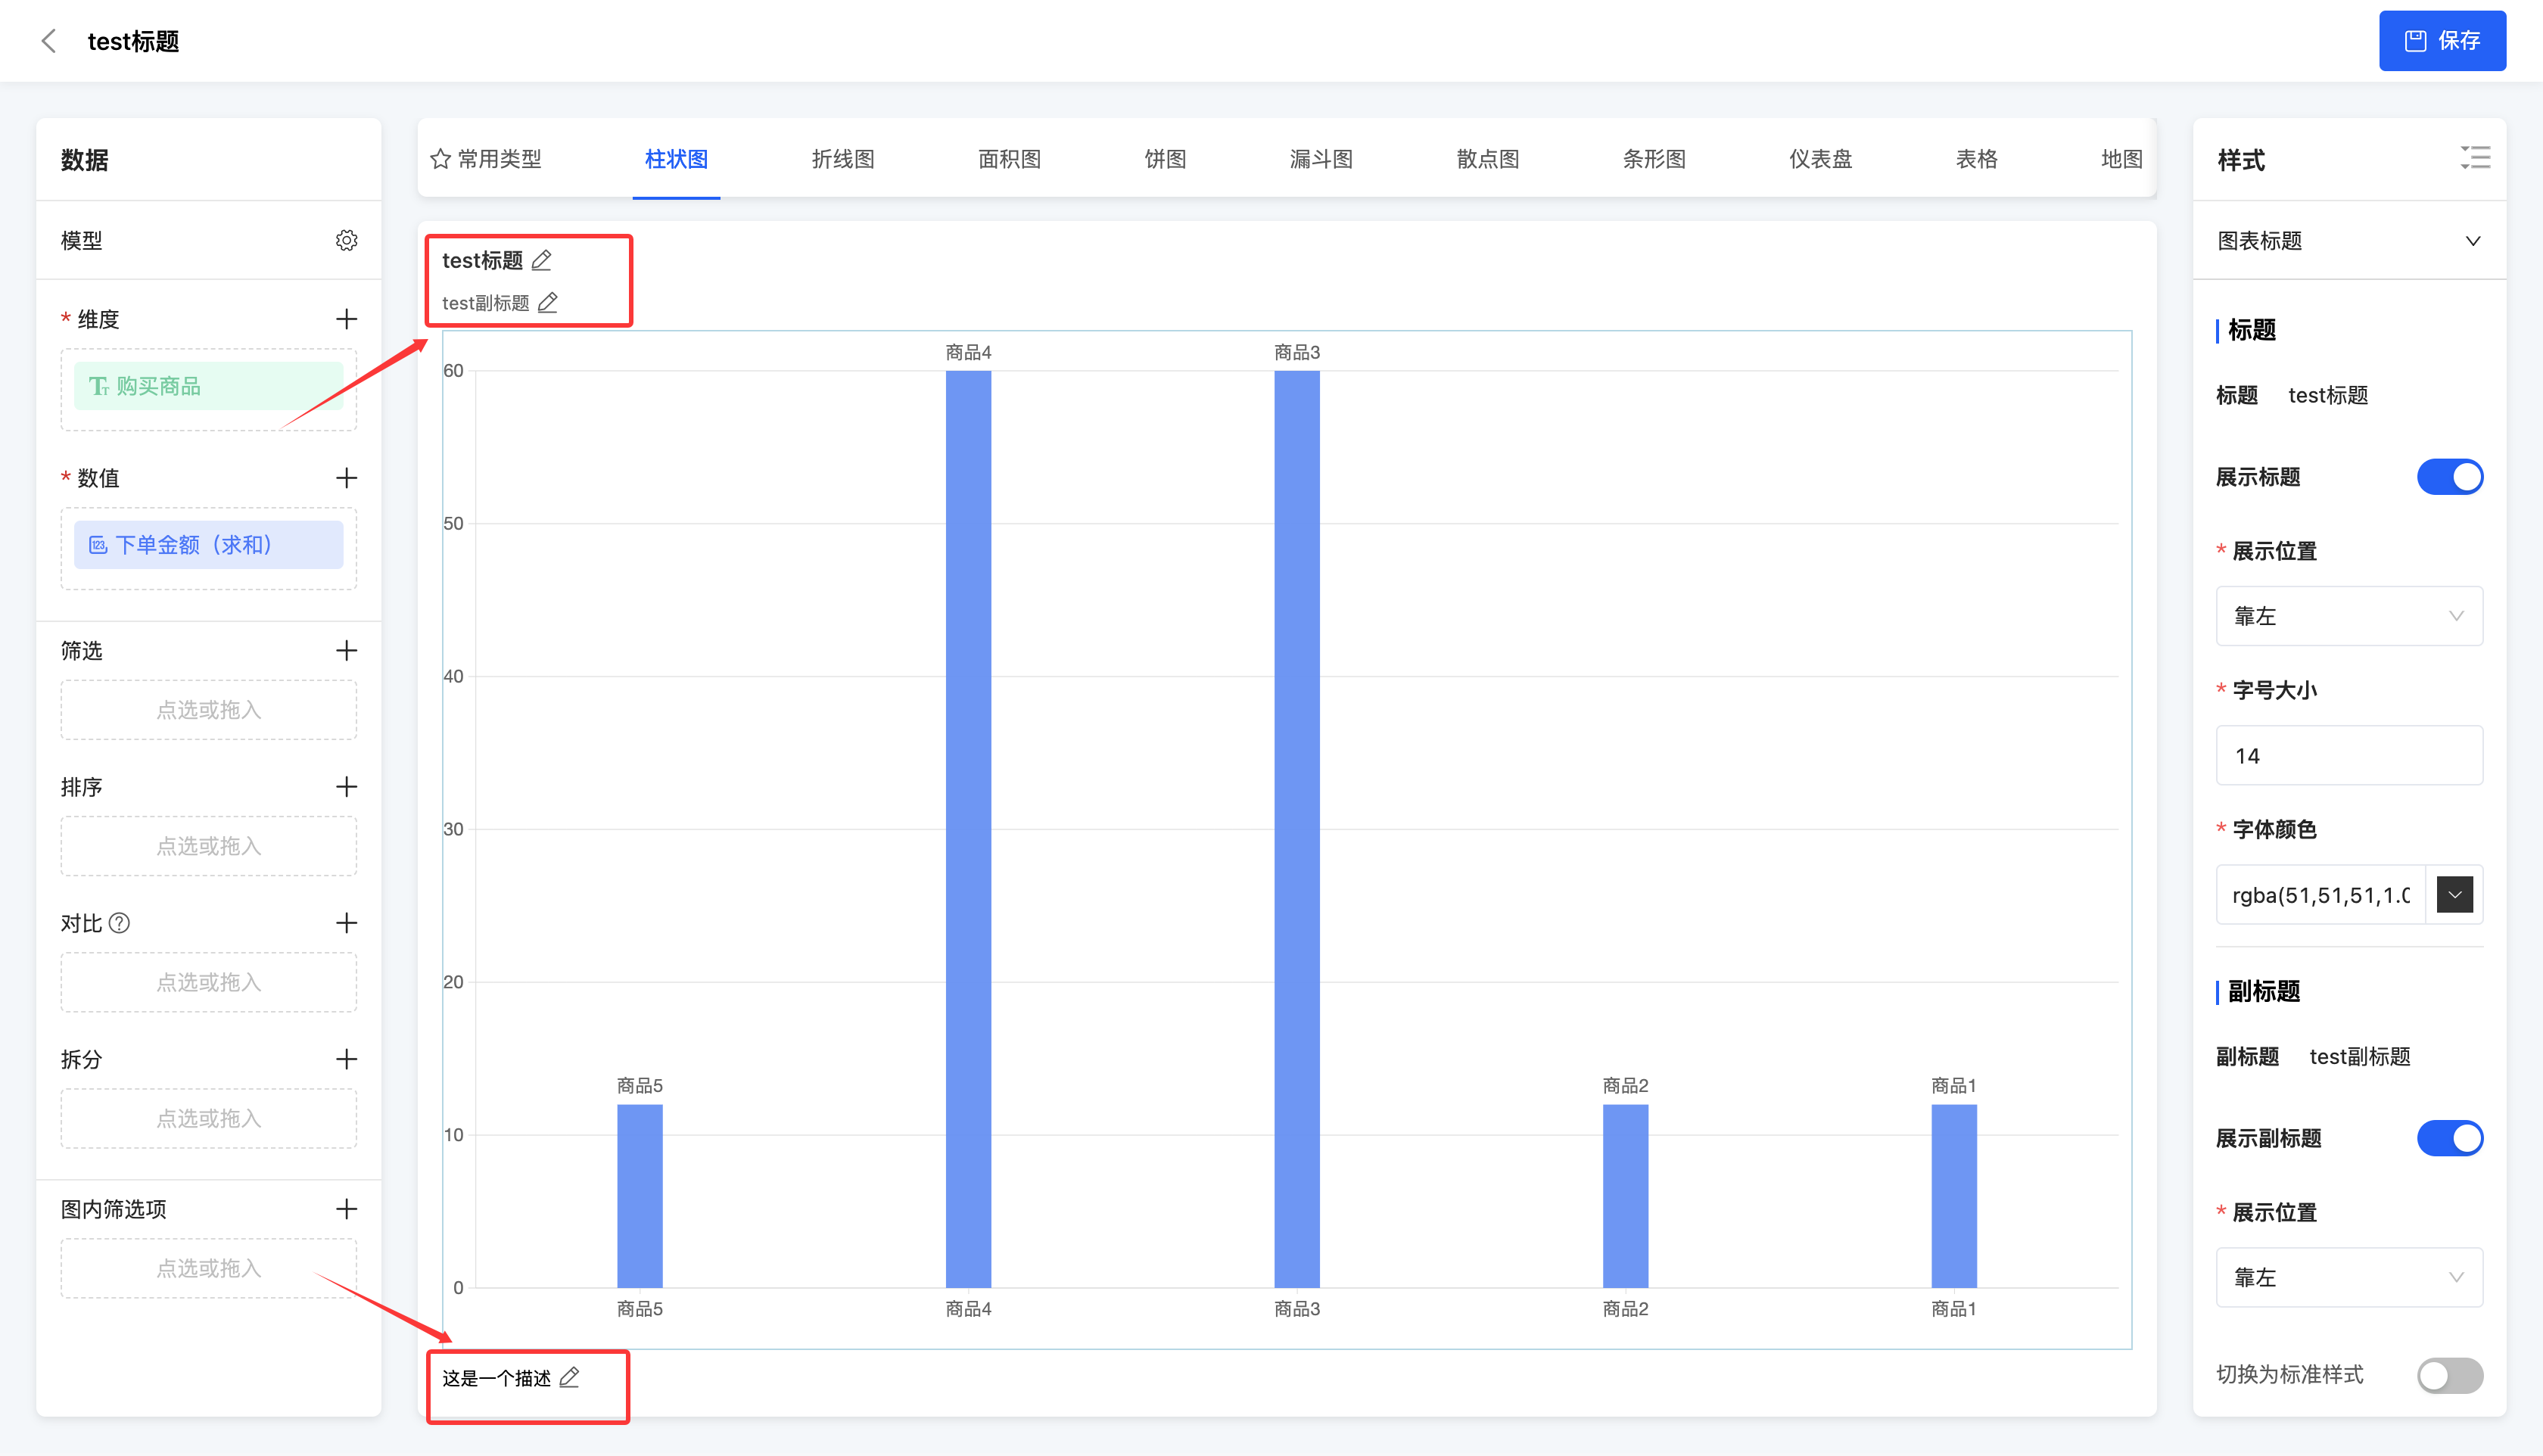
- When designing the chart, click the "Settings" icon to change the data source type and method. Click the title area, subtitle area, description area, or the "Edit" icon, enter the information, and then you can successfully edit the chart.
V. Design a Chart
1. Function Introduction
After the chart is created, you can automatically enter or manually enter the chart design interface. On this interface, users can perform personalized design and layout of the chart, including selecting different chart types, to meet diverse needs and styles. (See the chart design documentation for details.)
Note
When a chart is hidden after being published, you cannot manually enter the chart design interface.
2. Operation Method
Click "Edit" to enter the chart design interface.
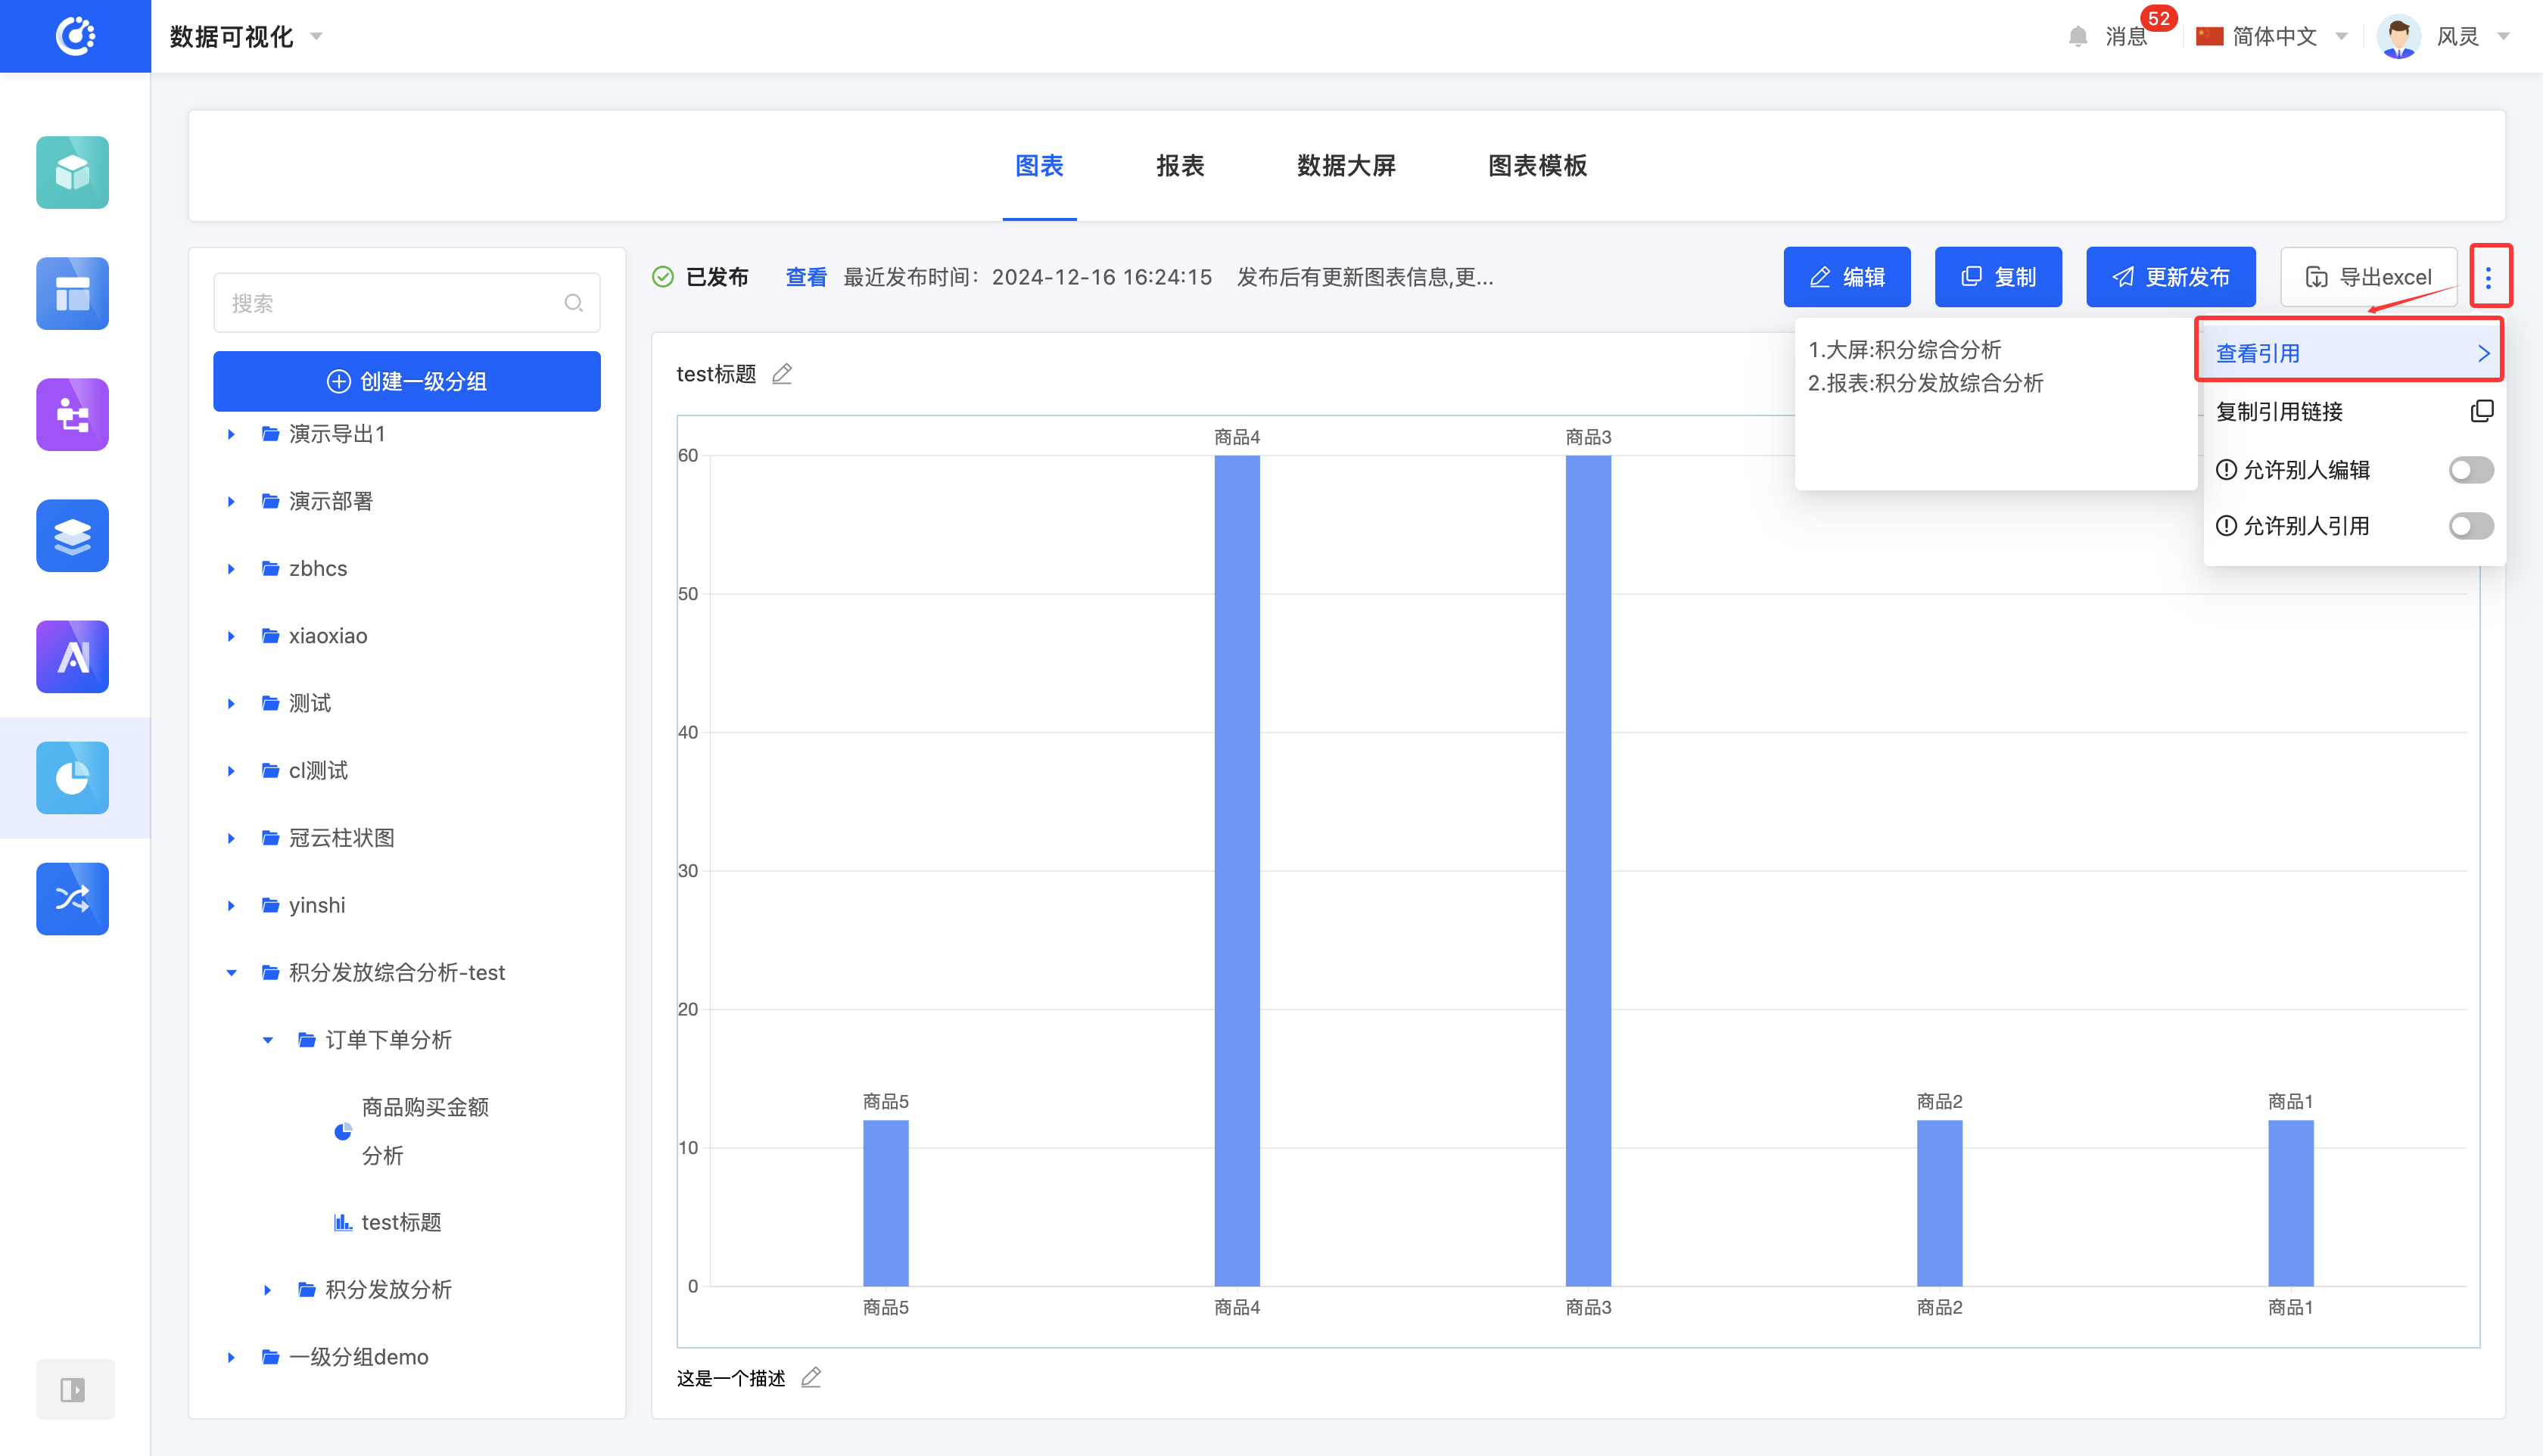
VI. View Reference Information
1. Function Introduction
You can view various elements that have a reference relationship with the chart, including reports, data dashboards, pages, etc.
Note
- For published charts, a reference link is provided, which can be directly copied and used elsewhere.
- For unpublished charts, no reference link is provided.
2. Operation Method
Click "View References" to view the reference information.
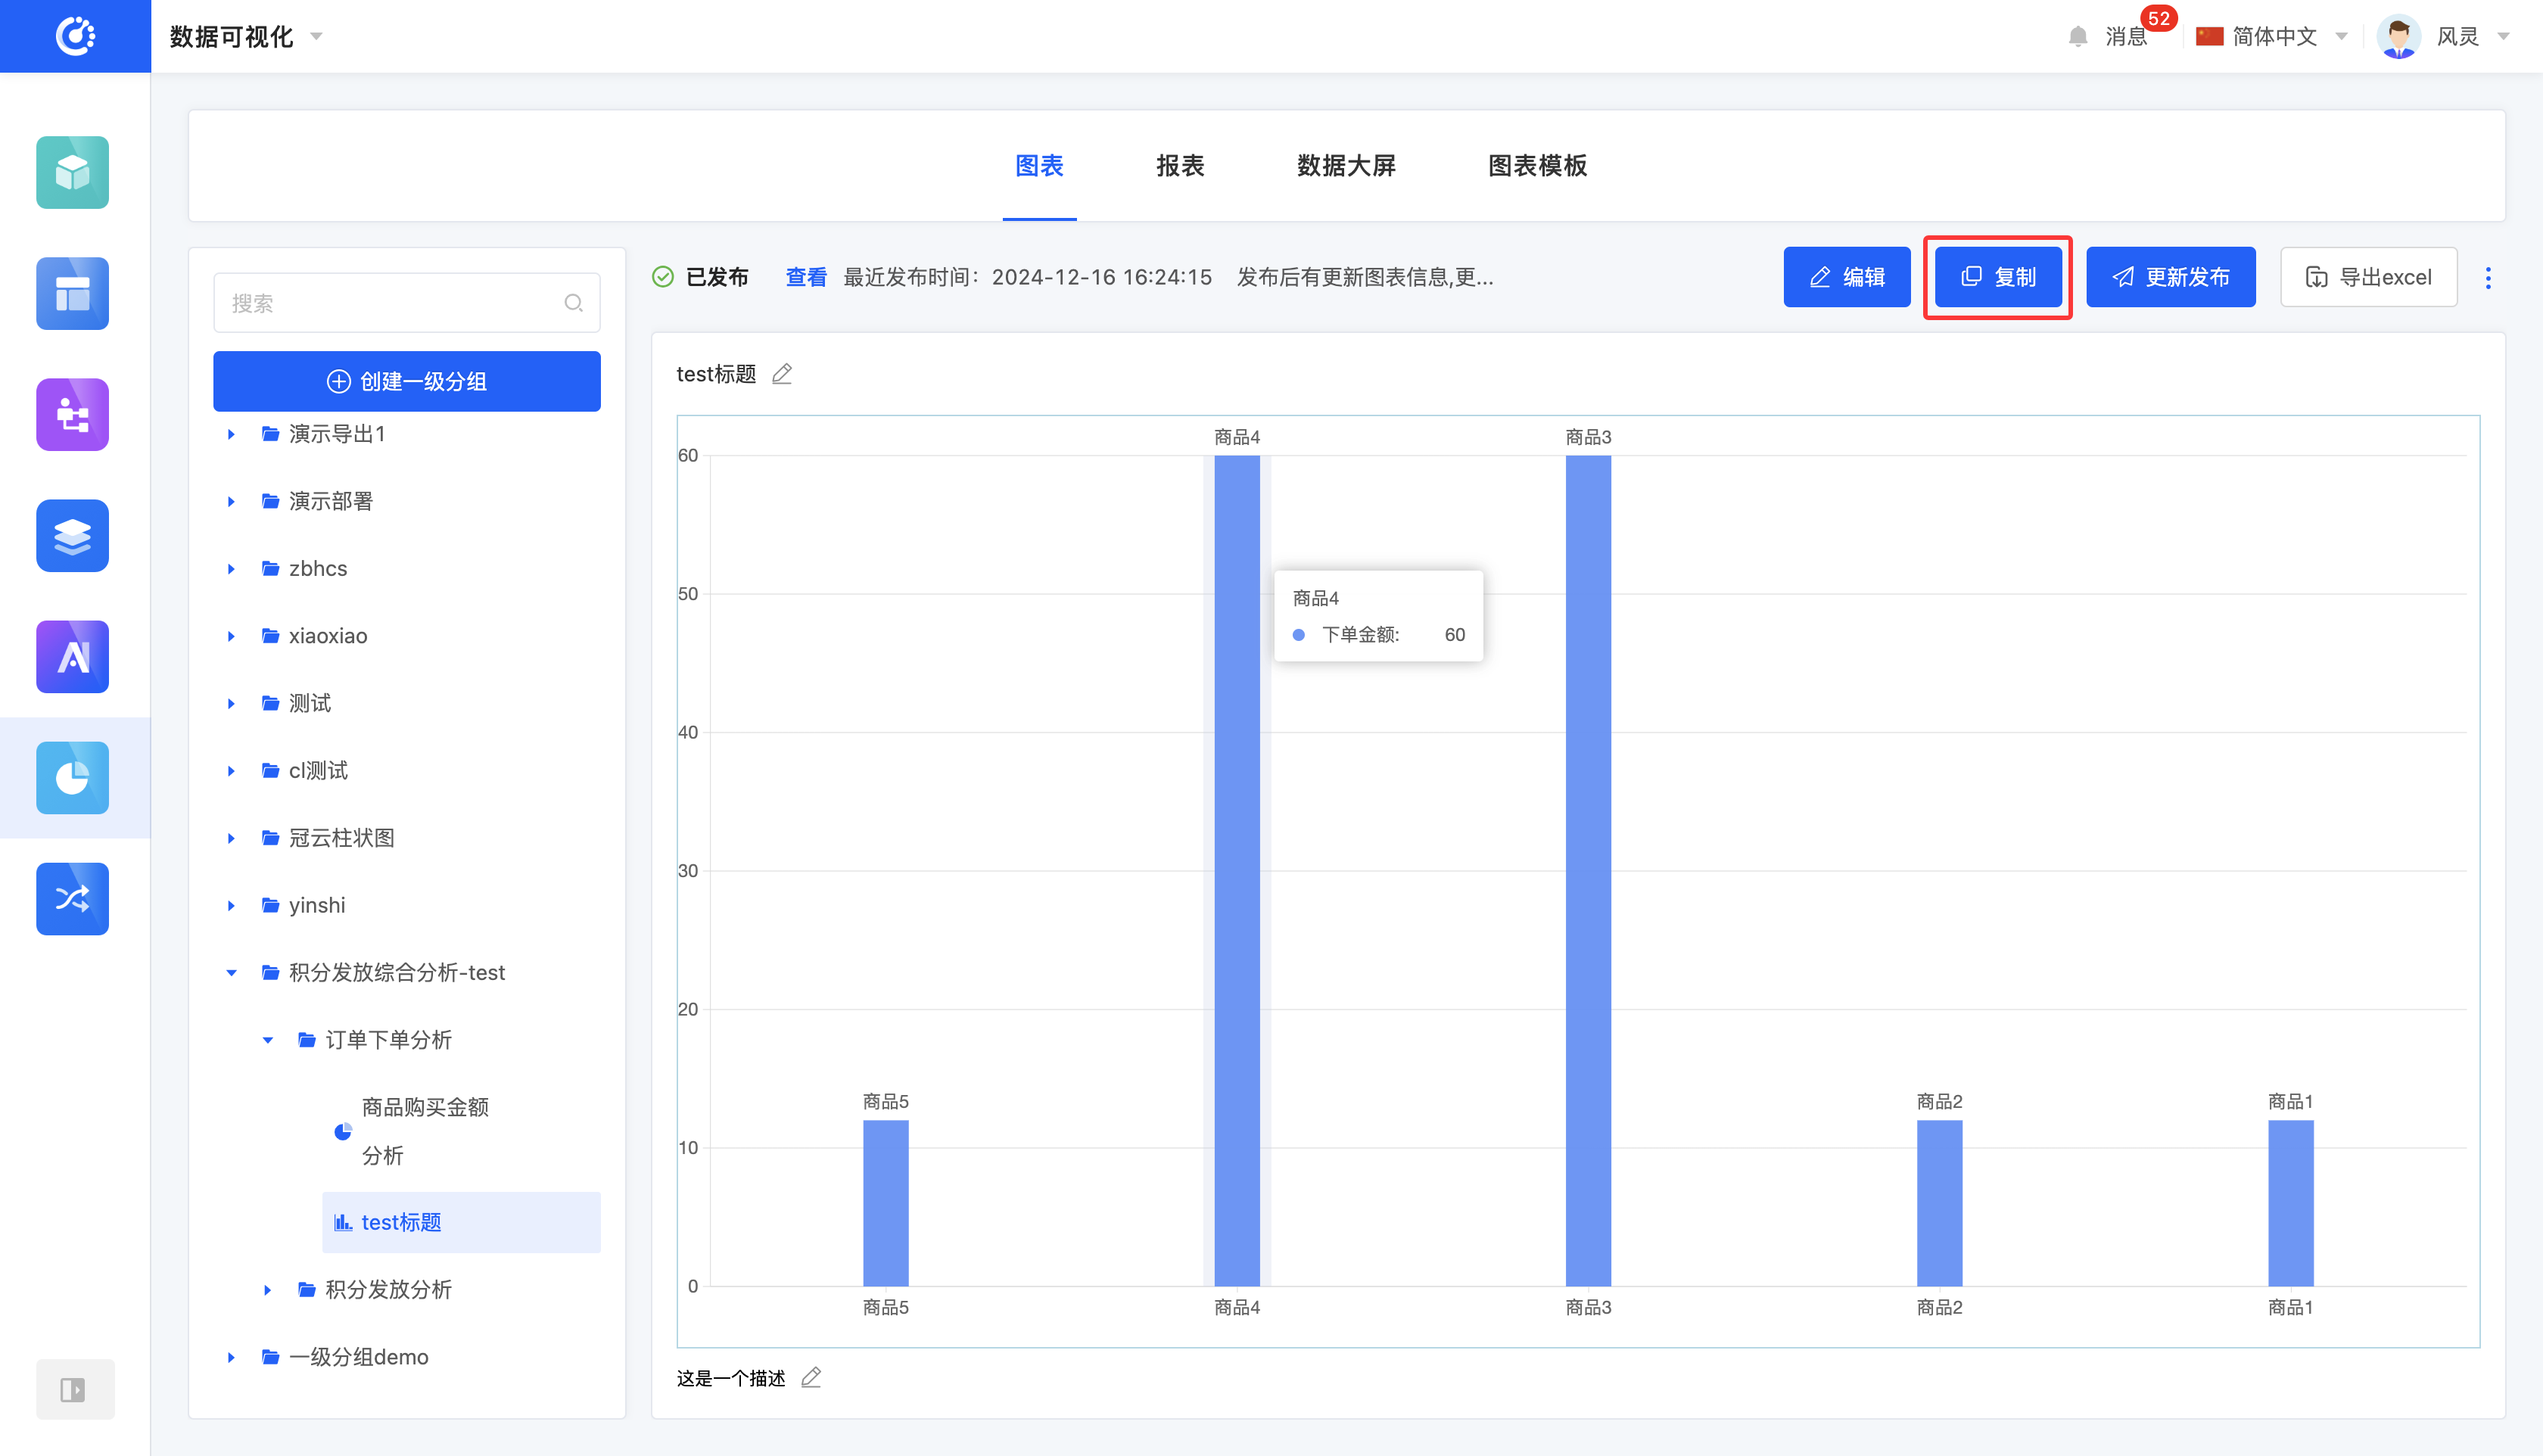
VII. Copy a Chart
1. Function Introduction
A chart copying function is provided. This function will generate a copy at the bottom of the group where the original chart is located. The title of the copy is "copy of [original chart name]".
2. Operation Method
Click "Copy" to successfully copy the chart.
VIII. Publish a Chart
1. Function Introduction
After the chart design is completed, users can choose to publish the chart. The published chart can be referenced in other designers, and the latest publishing time will be displayed. If the content of the chart is updated after publishing, the original "Publish" button will change to "Update and Publish".
Note
If the content is updated but not republished, the places where the chart is referenced will still display the old version of the content.
Tip
When a chart is saved but not published, it can be referenced in reports and data dashboards.
Note
When a chart is hidden, it cannot be published.
2. Operation Method
Click "Publish/Update and Publish" to successfully publish the chart.
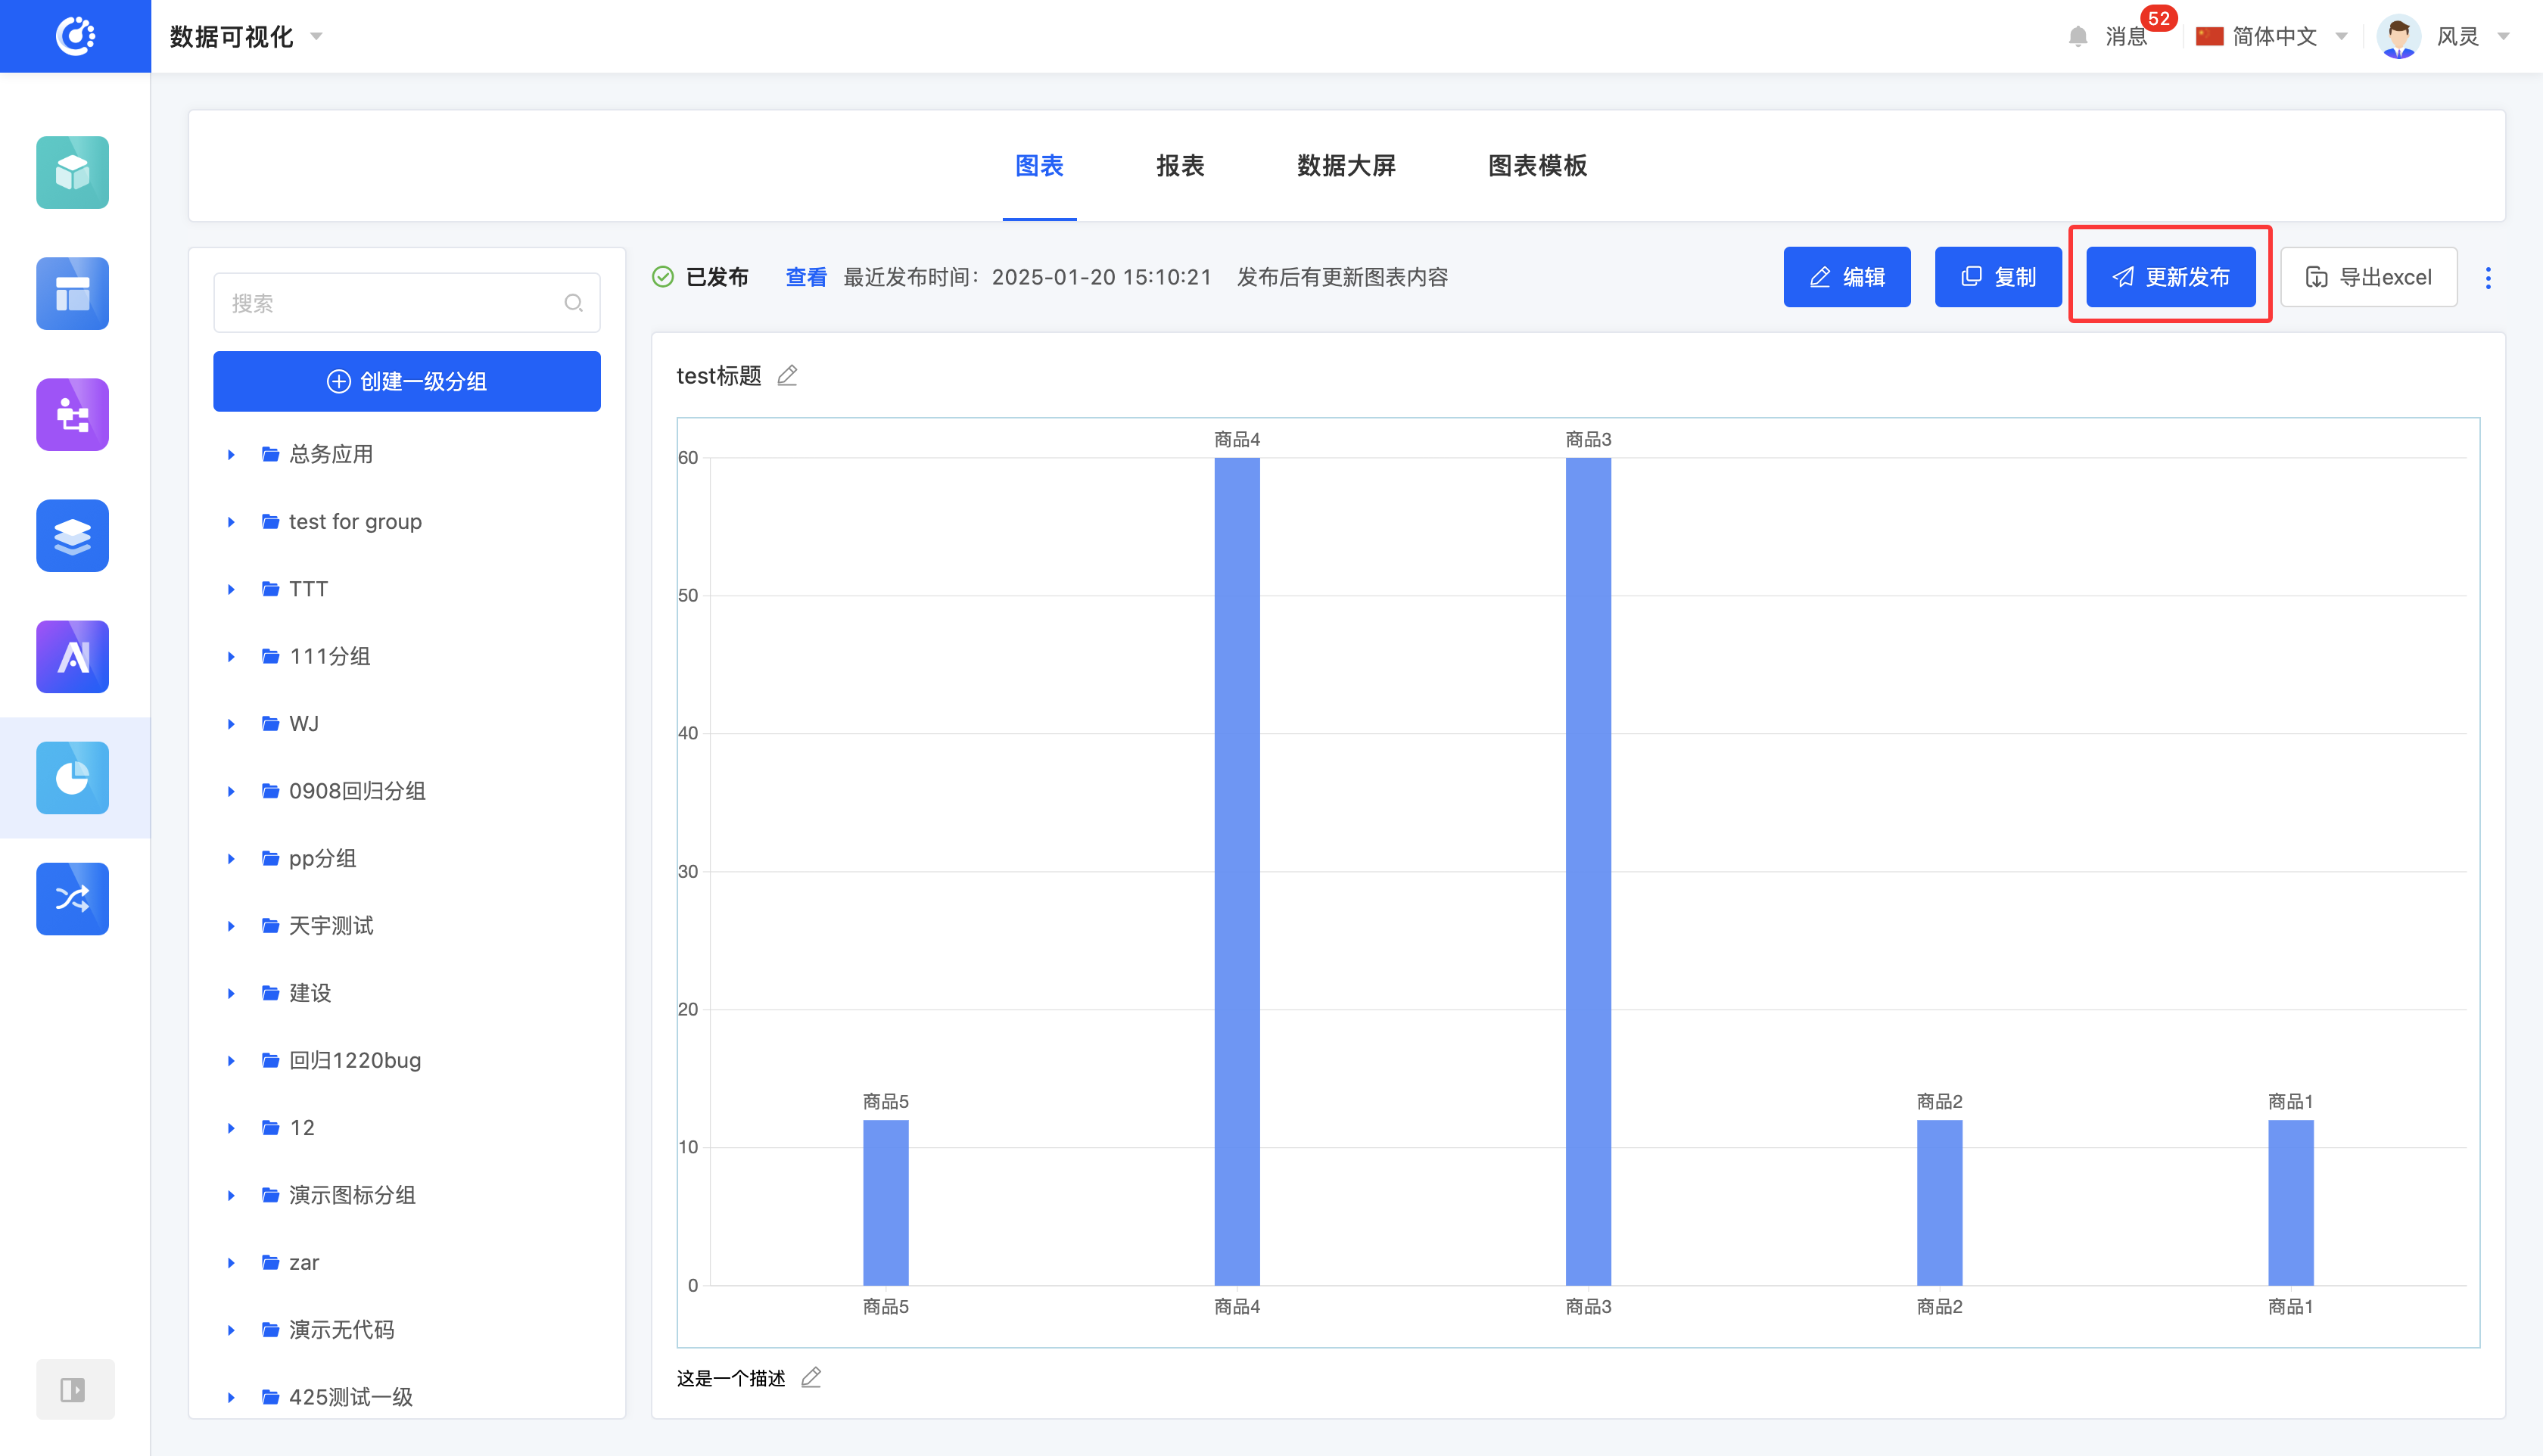
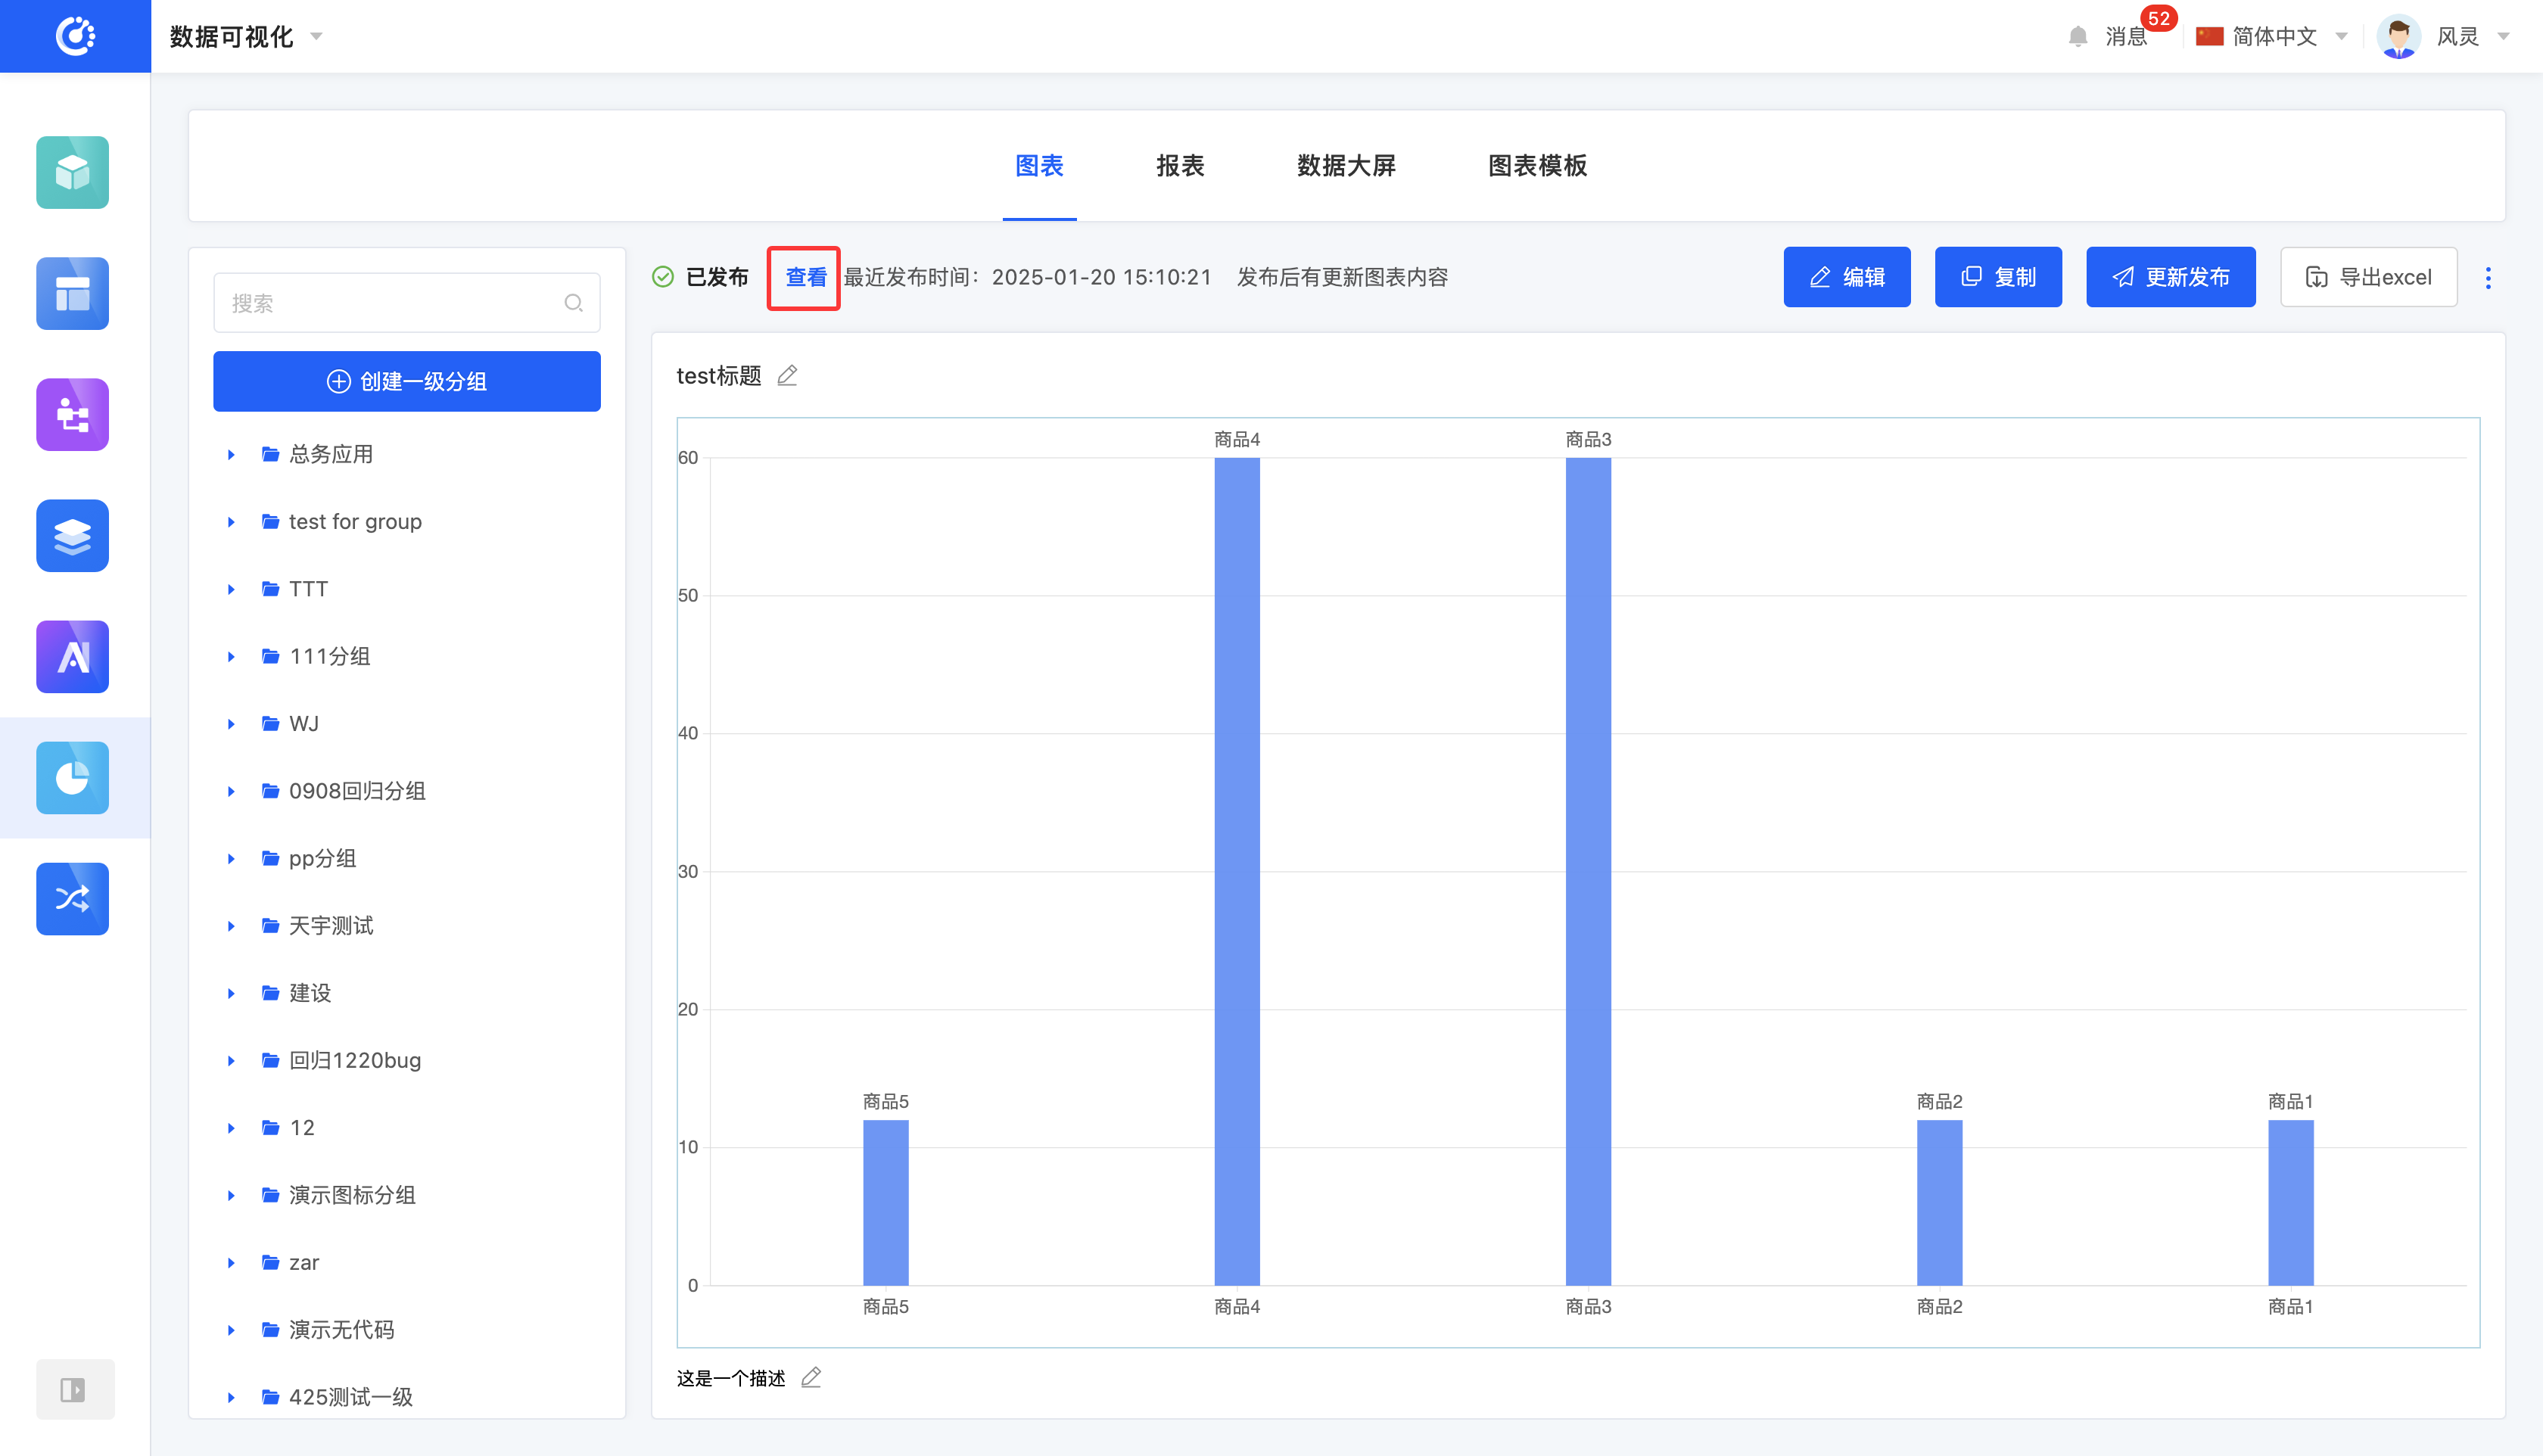
IX. View the Latest Published Version
1. Function Introduction
When a chart is updated after being published, the latest publishing time will be displayed in the upper-left area of the chart preview area. You can view the latest published version.
2. Operation Method
Click "View", and the chart preview area will display the latest published version.
X. Hide/Show a Chart
1. Function Introduction
You can hide charts that are not currently in use. If needed in the future, you can set the hidden chart to be visible and use it again. Hidden charts cannot be referenced, but it does not affect the already referenced data.
Note
- For published charts, they cannot be edited after being hidden.
- For unpublished charts, they can be edited after being hidden.
2. Operation Method
Click "Hide" to set the chart to the hidden state. Click again to restore the chart to the visible state.

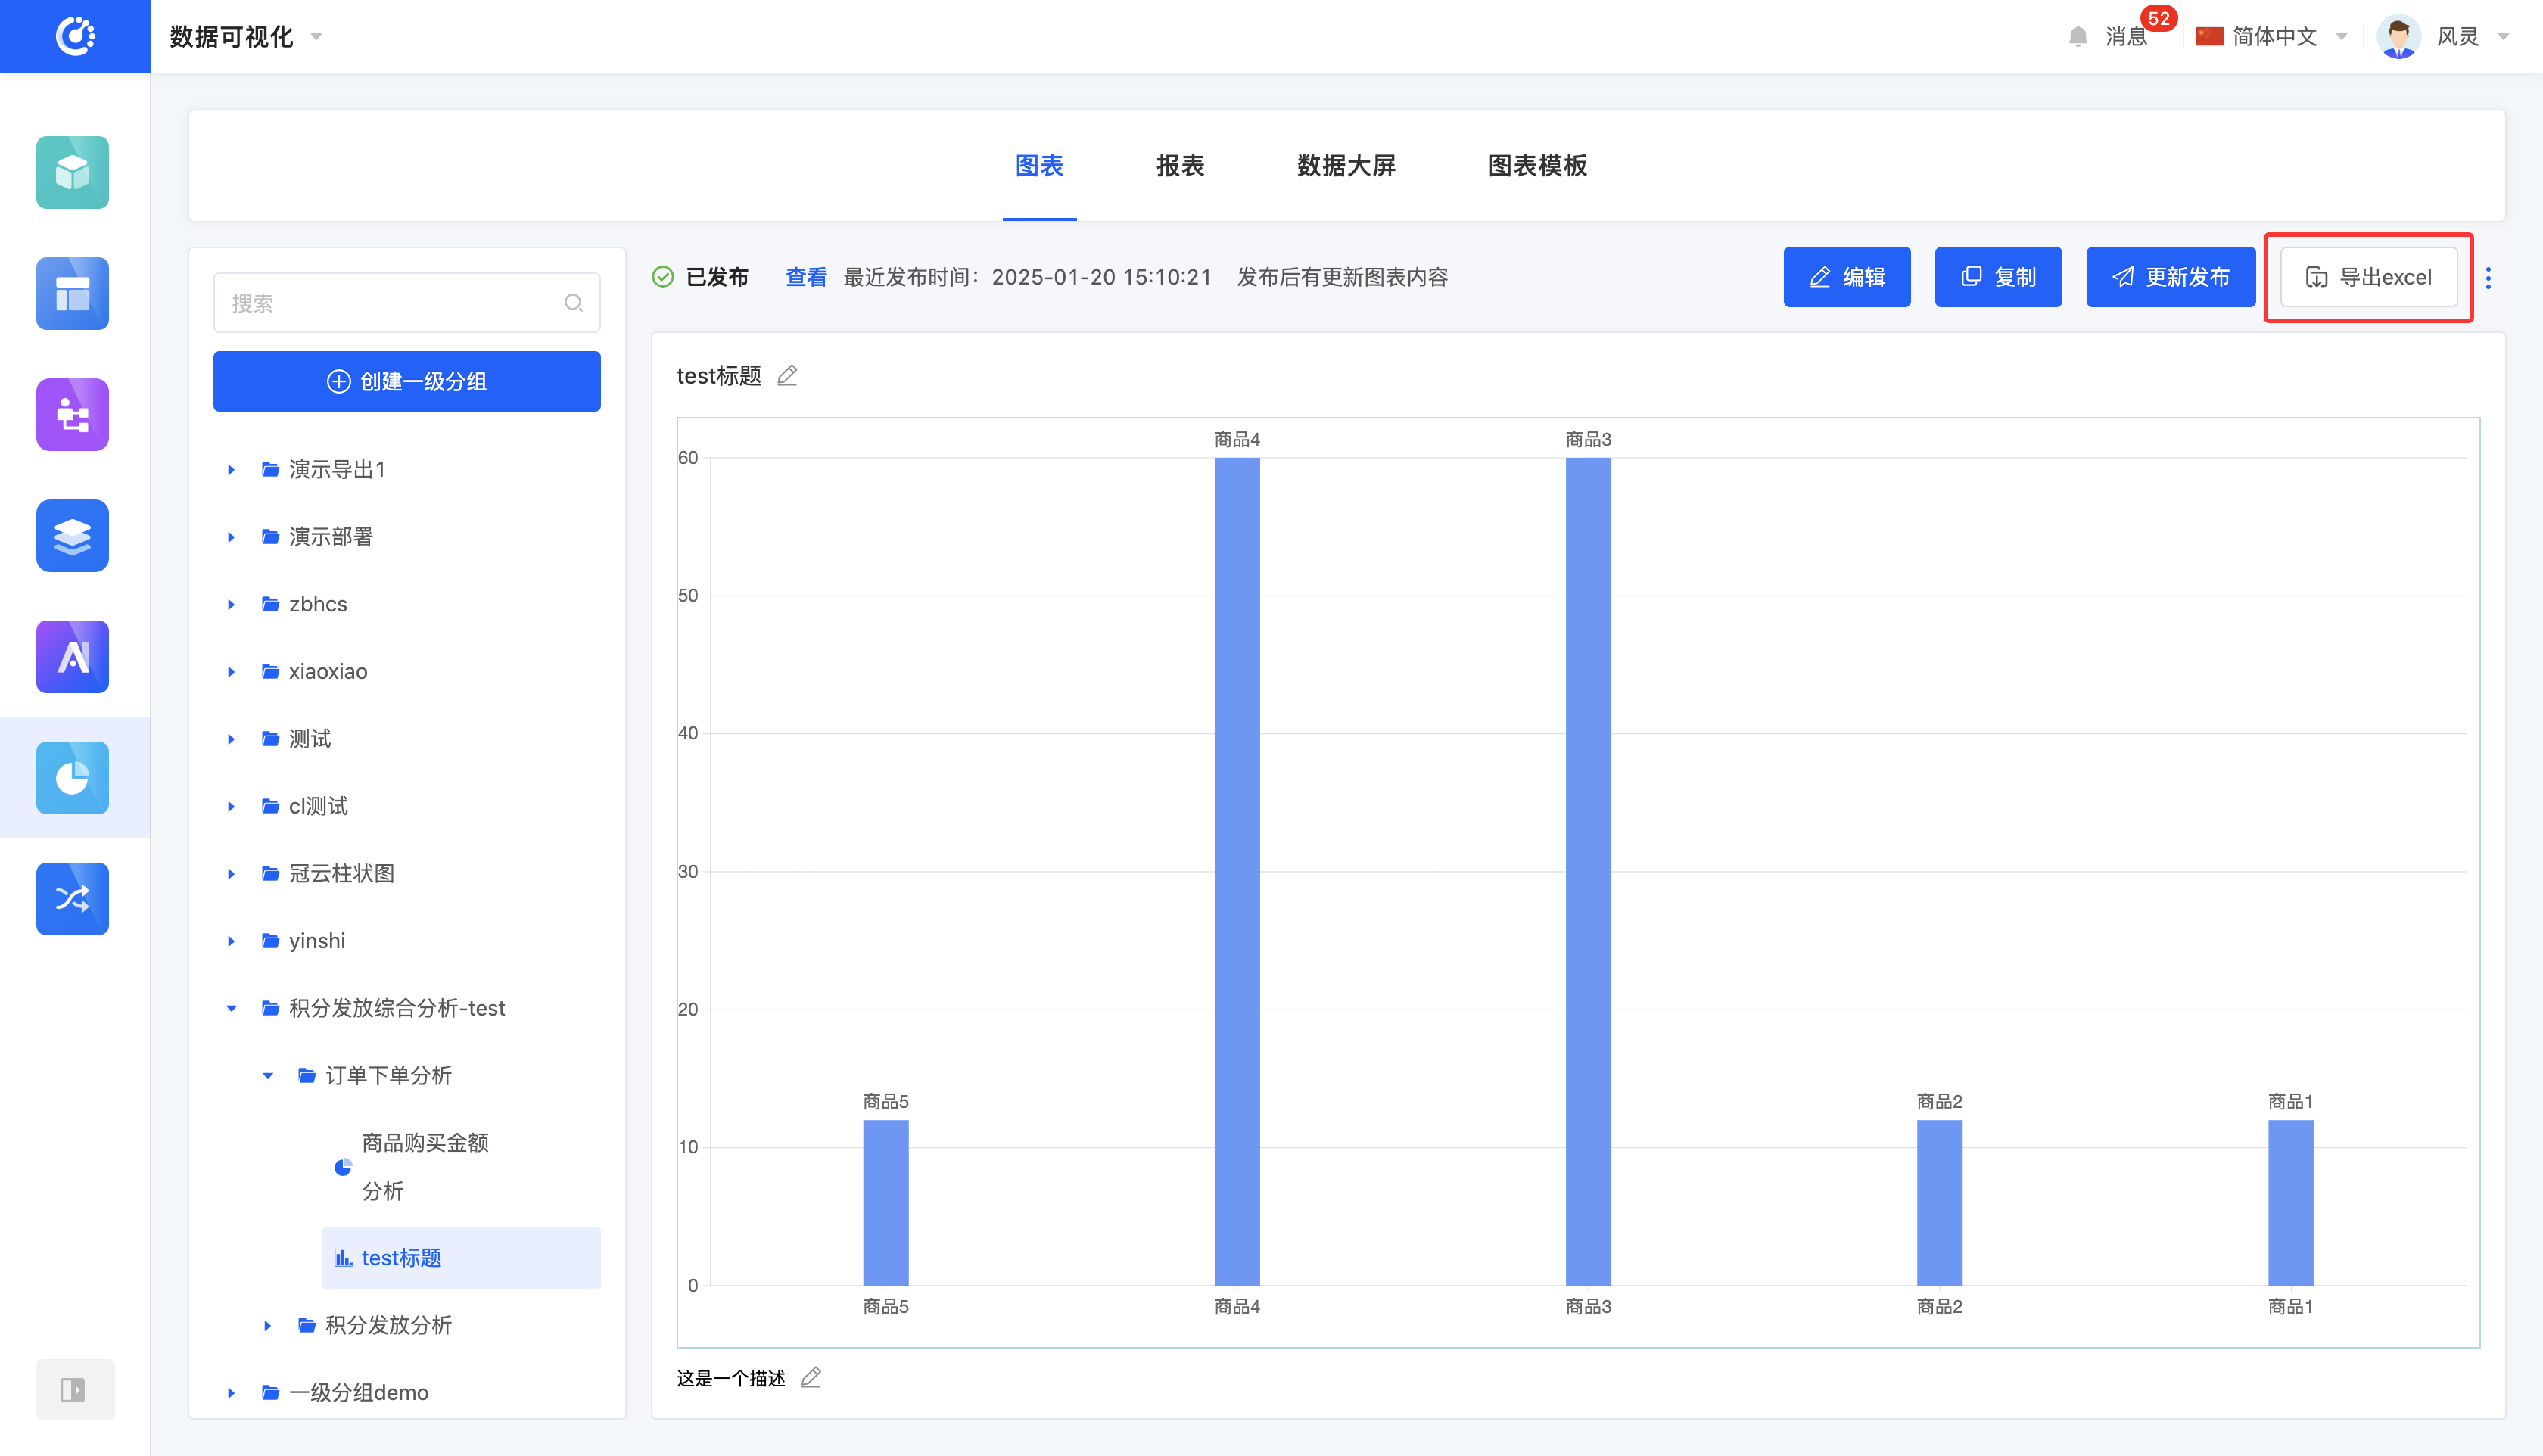
XI. Export to Excel
1. Function Introduction
You can export the chart data content to a standardized Excel file format.
2. Operation Method
Click "Export to Excel" to export the data in the current chart in Excel format.
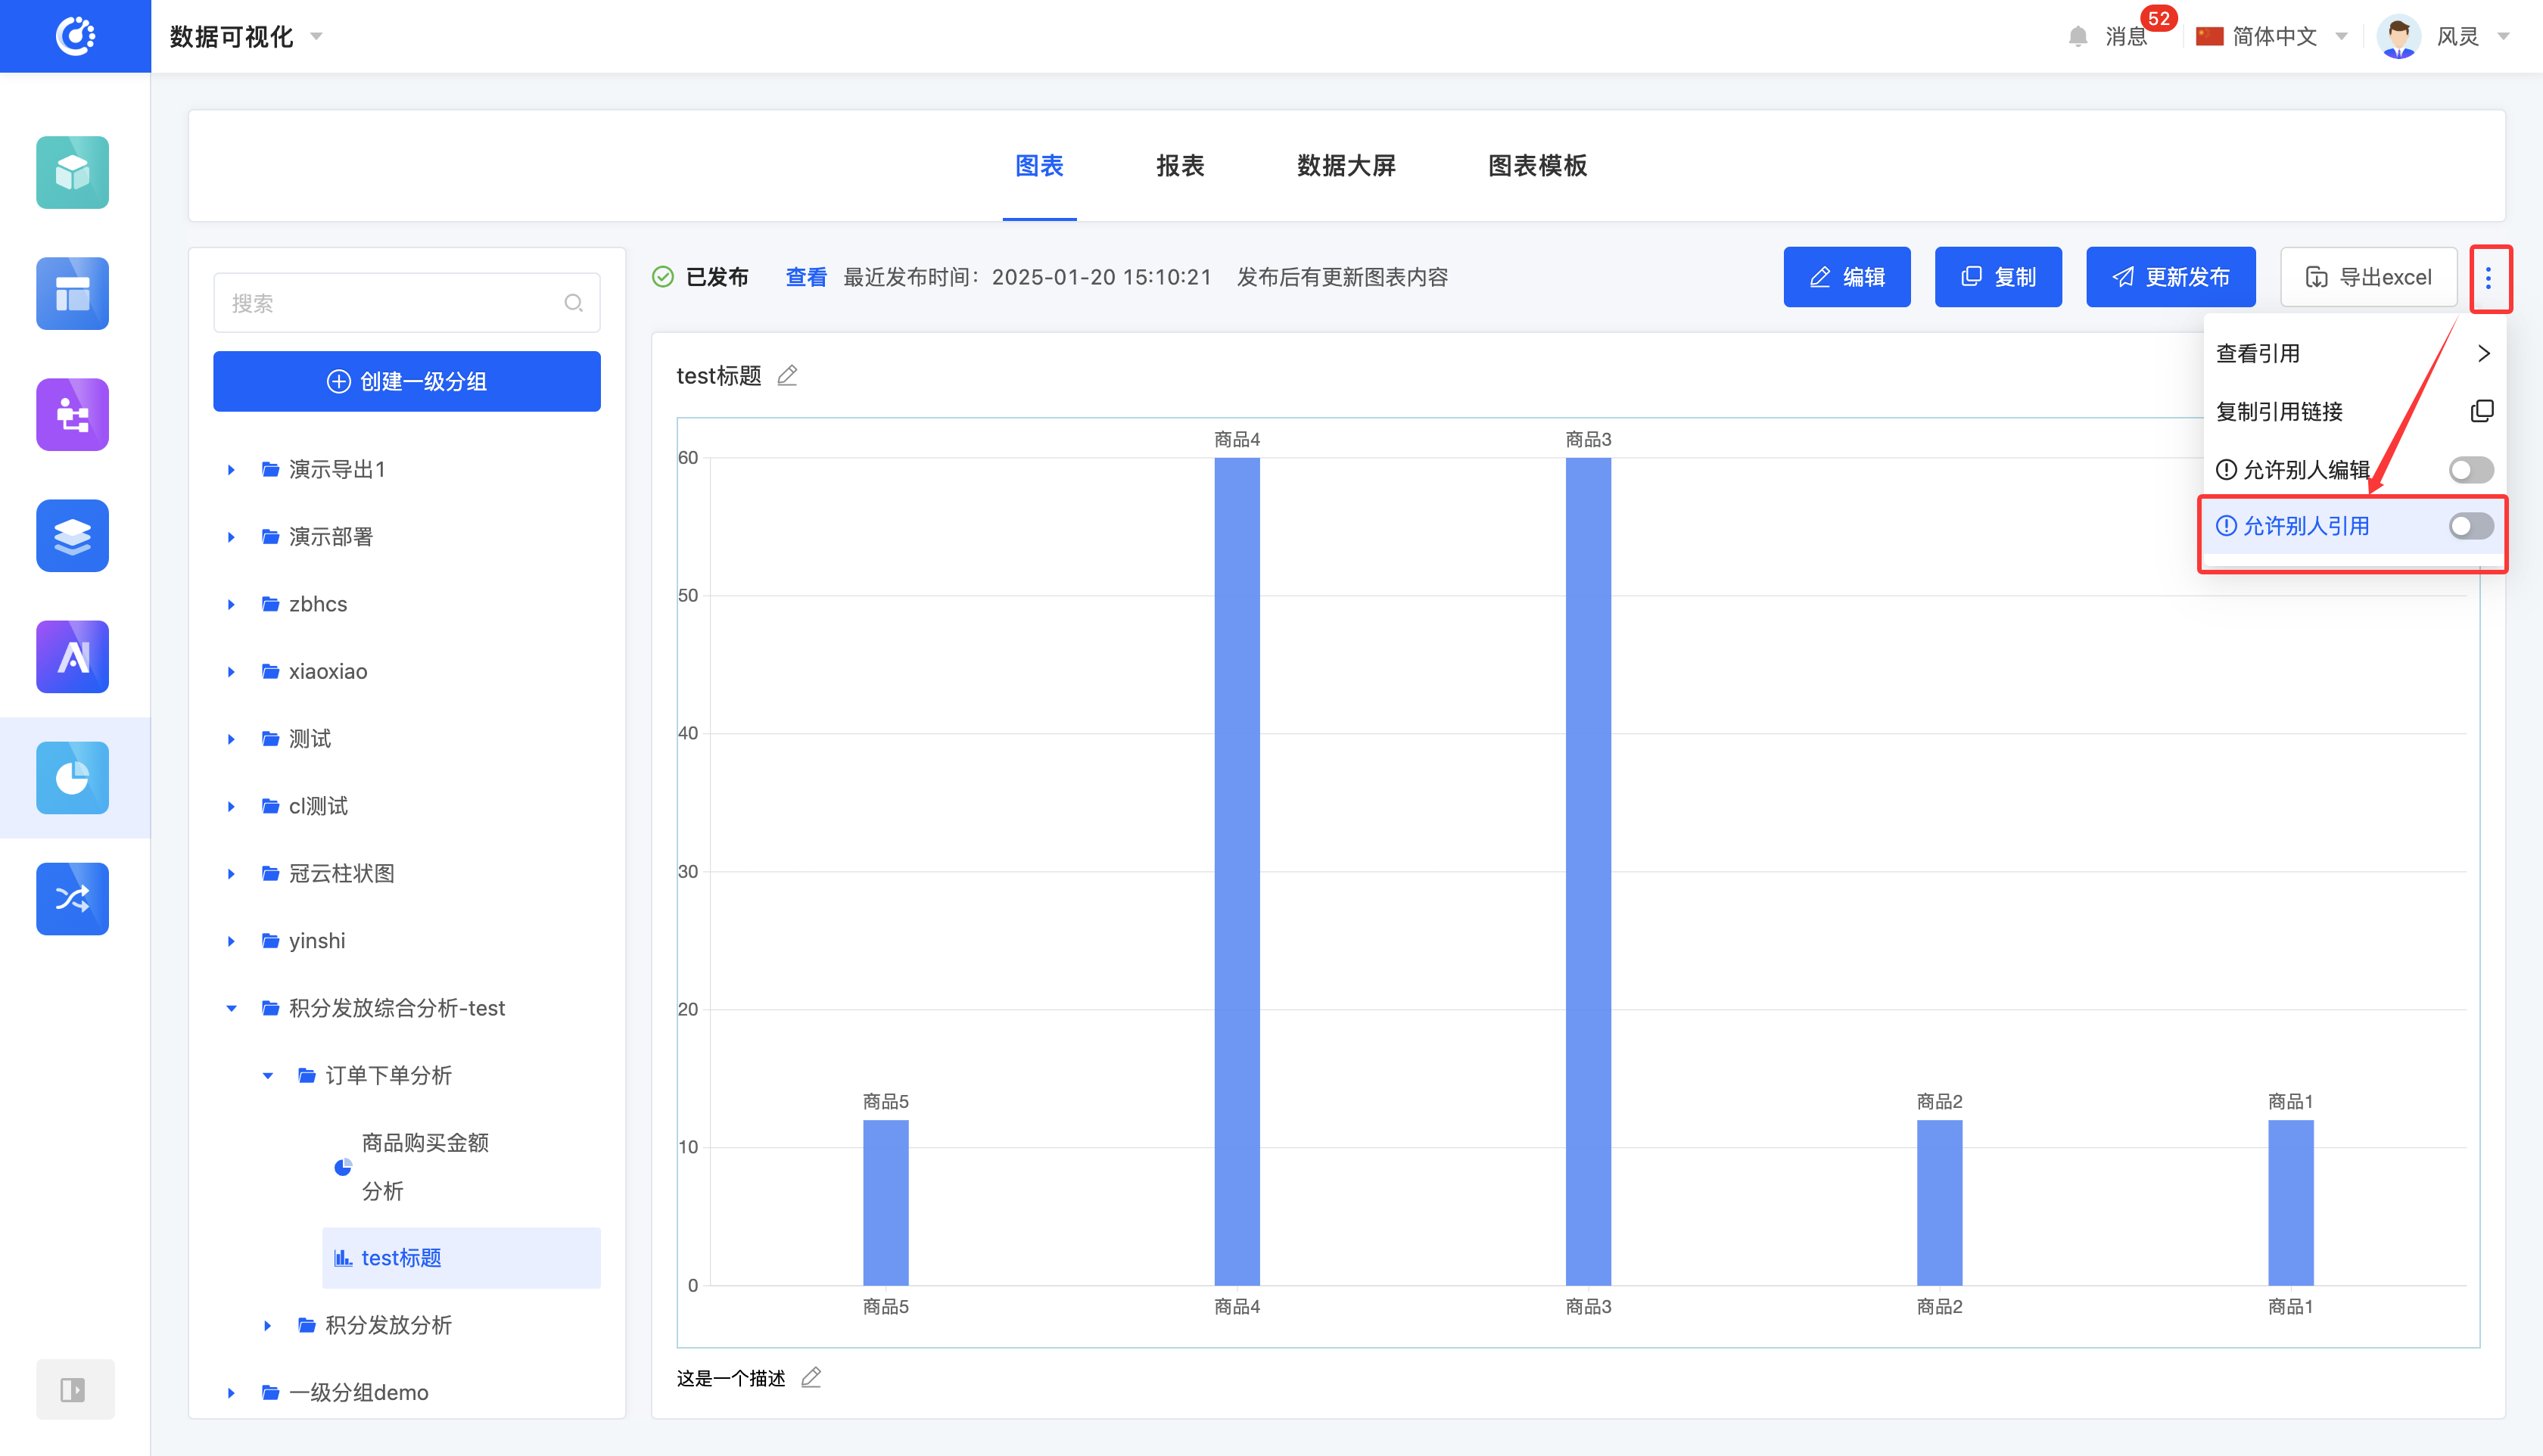
XII. Allow Others to Edit
1. Function Introduction
Customizable editing permissions are supported. When the editing permission is turned off, non-creators cannot edit the content even if they log in.
2. Operation Method
Click the switch to change the state of this function.

XIII. Allow Others to Reference
1. Function Introduction
Customizable reference permissions are supported. When the reference permission is turned off, non-creators cannot reference the content even if they log in.
2. Operation Method
Click the switch to change the state of this function.
XIV. Delete a Chart
1. Function Introduction
When a chart is no longer needed, you can choose to delete it. If you are not sure whether to delete the chart, you can hide it first.
Note
Before deleting, make sure that the chart is not referenced by other reports, data dashboards, or pages; otherwise, the deletion operation cannot be performed.
Warning
Once a chart is deleted, it cannot be recovered. Please operate with caution!
2. Operation Method
Click the "Delete" icon, confirm the deletion, and then the chart will be deleted.

XV. Attachment: Glossary
Term | Description |
|---|---|
| Chart | Refers to specific chart information. After bringing in the data to be analyzed according to the chart template, a business chart will be generated. |
| Report | A combined style for designing charts. Adding the charts to be displayed together to a report forms a whole. You can adjust the proportion of individual charts on the report design page and publish the report. |
| Data Dashboard | A large-scale display system that can display data information in real-time. |