I. Overview
The debugging tool consists of two parts:
- Page Debugging
- API Debugging
Note:
The visual debugging tool can only be used for testing the current environment and cannot perform cross-environment testing.
(Ⅰ) Overview of Page Debugging
It provides a simple parsing of the front-end runtime context of the current page, mainly used to solve common issues such as metadata, permissions, and views.
(Ⅱ) Overview of API Debugging
Any standard request initiated by the Oinone platform can be checked using this debugging tool. It is mainly used for troubleshooting issues related to exception stacks, permissions, SQL execution, etc.
(Ⅲ) Expression Explanation
For the convenience of expression, the following content includes backend model fields/methods or GQL request-related information, and the expression rule is:
{ClassSimpleName/GQLNamespace}#{field/method}For example, backend model fields/methods: (This example is not in the platform code, only for demonstration)
public class ModuleDefinition {
    private String module;

    public void queryOne() {
        ...
    }
}ClassSimpleName is the class name of the Java class. In the above example, ClassSimpleName is ModuleDefinition. The module field in this Java class can be expressed as ModuleDefinition#module. The queryOne method in this Java class can be expressed as ModuleDefinition#queryOne.
For example:
{
  viewActionQuery {
    load(
      ...
    ) {
      ...
    }
  }
}GQLNamespace is the result of removing the Query or Mutation suffix from the first field of GQL. In the above example, GQLNamespace is viewAction. This GQL request calls the load method, which can be simply expressed as viewAction#load.
Note:
Generally, Java class names use PascalCase, while GQL uses camelCase. Therefore, the specific content can be distinguished by whether the first letter is uppercase or lowercase.
All subsequent content expressions are based on this.
II. Instructions for Using the Debugging Tool
(Ⅰ) Accessing the Debugging Tool Page
On the page that needs debugging, access the debugging tool page by modifying the browser URL. As shown in the following figure:
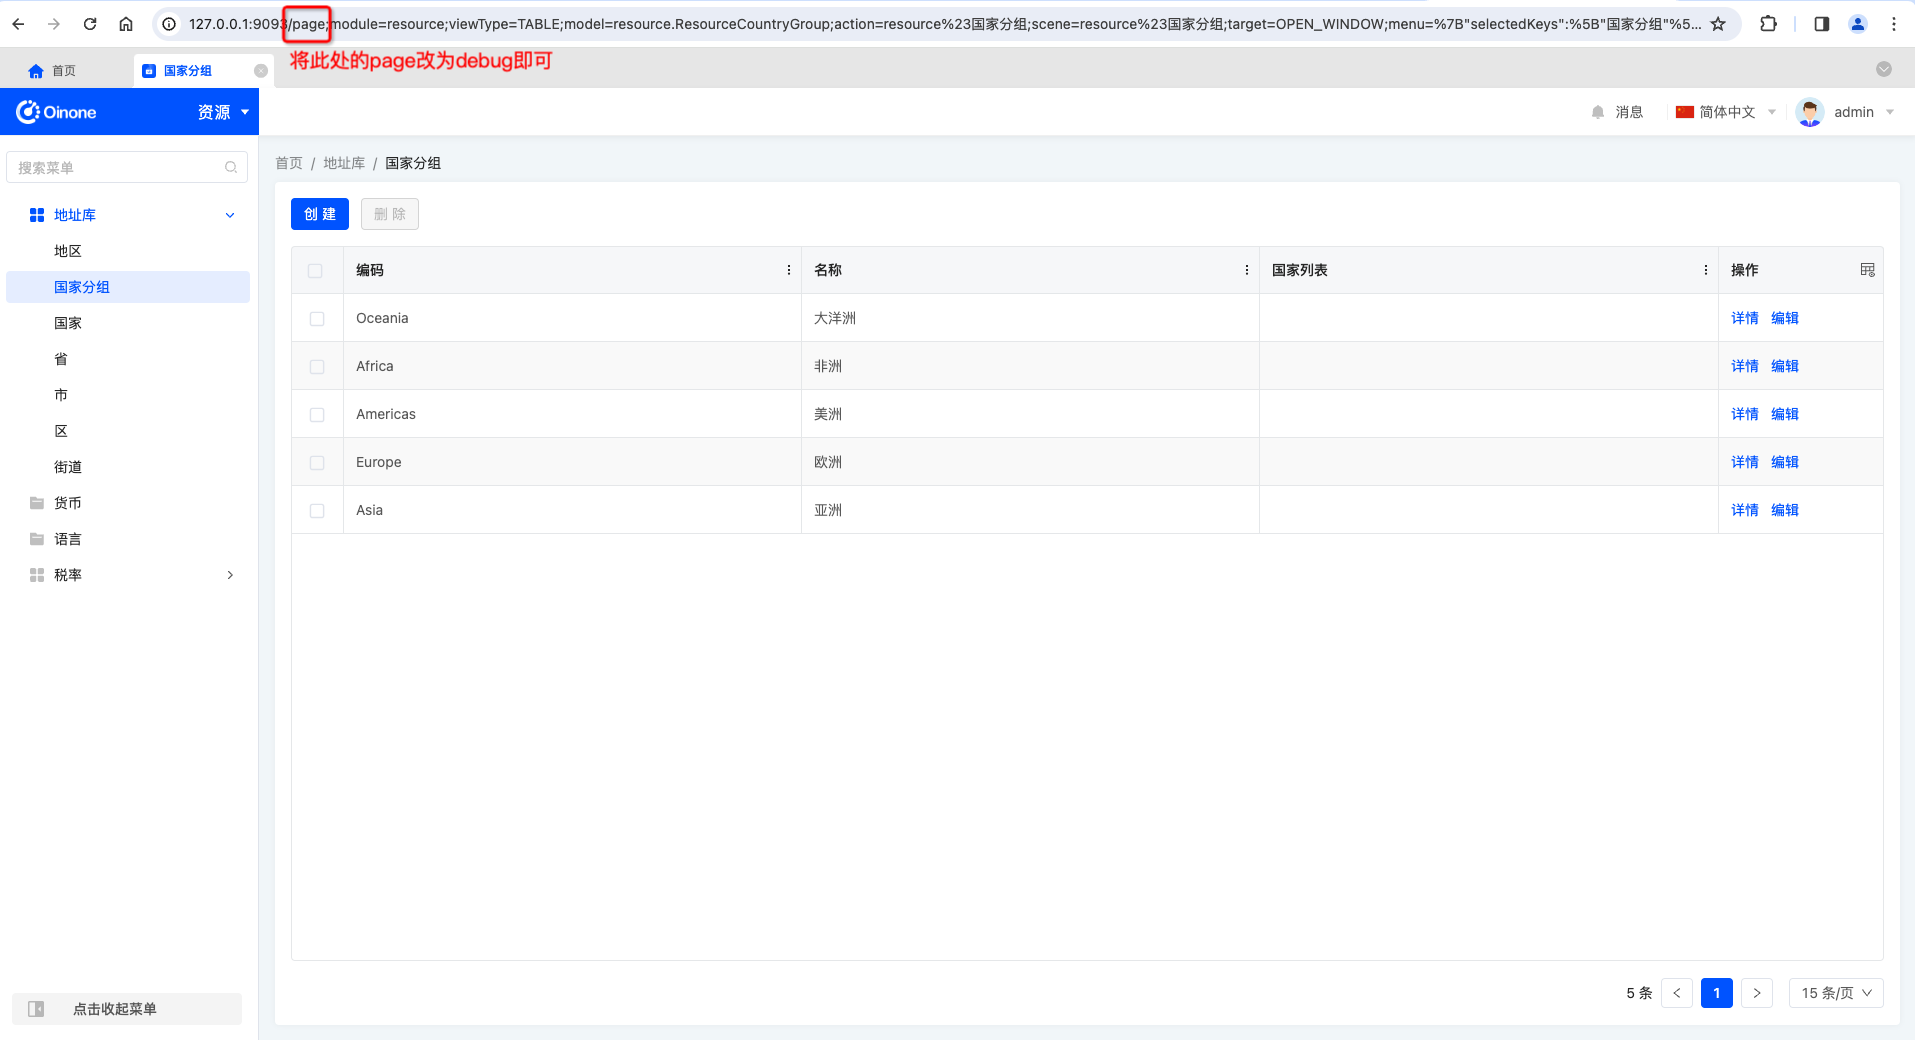
If the URL of the page to be debugged is as follows:
http://127.0.0.1:9093/page;module=resource;viewType=TABLE;model=resource.ResourceCountryGroup;action=resource%23%E5%9B%BD%E5%AE%B6%E5%88%86%E7%BB%84;scene=resource%23%E5%9B%BD%E5%AE%B6%E5%88%86%E7%BB%84;target=OPEN_WINDOW;menu=%7B%22selectedKeys%22:%5B%22%E5%9B%BD%E5%AE%B6%E5%88%86%E7%BB%84%22%5D,%22openKeys%22:%5B%22%E5%9C%B0%E5%9D%80%E5%BA%93%22,%22%E5%9C%B0%E5%8C%BA%22%5D%7DChanging page to debug will take you to the debugging page of this page, as shown below:
http://127.0.0.1:9093/debug;module=resource;viewType=TABLE;model=resource.ResourceCountryGroup;action=resource%23%E5%9B%BD%E5%AE%B6%E5%88%86%E7%BB%84;scene=resource%23%E5%9B%BD%E5%AE%B6%E5%88%86%E7%BB%84;target=OPEN_WINDOW;menu=%7B%22selectedKeys%22:%5B%22%E5%9B%BD%E5%AE%B6%E5%88%86%E7%BB%84%22%5D,%22openKeys%22:%5B%22%E5%9C%B0%E5%9D%80%E5%BA%93%22,%22%E5%9C%B0%E5%8C%BA%22%5D%7DNote:
It is common practice to paste the modified new URL into a new browser tab to retain the original page for continued viewing of relevant information.
(Ⅱ) Debugging Tool Page
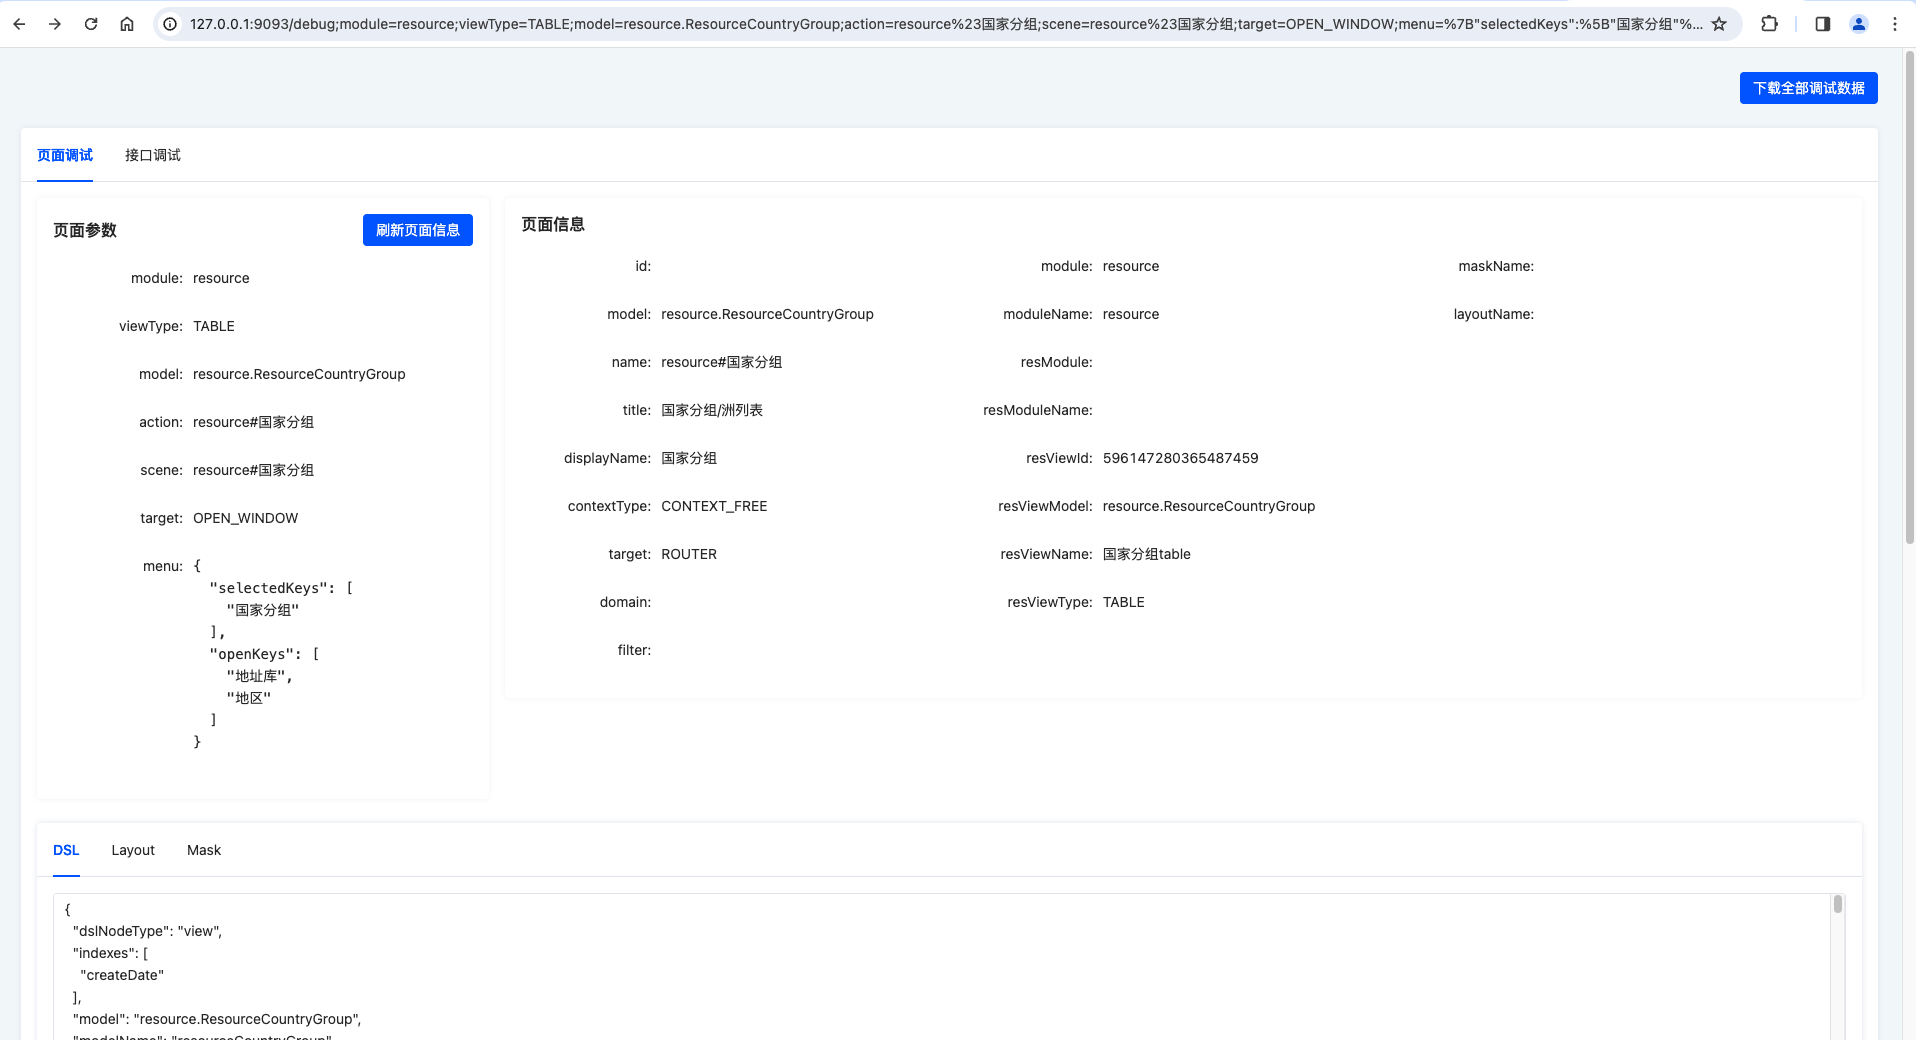
After entering the debugging tool page, you will see the page shown in the following figure:
1. Overview of Debugging Page Information
- Download All Debugging Data: Includes all data from
Page DebuggingandAPI Debugging.- Page debugging data includes
page parameters,viewAction#load, and other page data. - API debugging data only includes the latest API debugging-related data; no data will be available if no request has been initiated.
- Page debugging data includes
Overview of Page Debugging Information
- Page Parameters: All parameters in the current URL.
- module: Module name.
ModuleDefinition#name - viewType: View type.
ViewAction#resView#viewType - model: Current jump action model code.
ViewAction#model - action: Current jump action name.
ViewAction#name
- module: Module name.
- Page Information: Basic information returned by the
viewAction#loadAPI.- id: Current jump action ID.
- model: Same as the URL parameter
model. - name: Same as the URL parameter
action. - title: Alternative for browser title and breadcrumb display name.
- displayName: Alternative for browser title and breadcrumb display name.
- contextType: Data interaction context type.
- target: Backend-configured routing type, different from the target in URL parameters.
- domain: User-visible filtering conditions, which will be回填 to the
search areaaccording to rules. - filter: User-invisible filtering conditions, appended to the query conditions through the backend
DataFilterHook. - module: Jump action loading module code.
- moduleName: Jump action loading module name.
- resModule: Target view module code.
- resModuleName: Target view module name, used for module jumping.
- resViewId: Target view ID, i.e., the current page view ID.
- resViewModel: Target view model code, i.e., the current page view model code.
- resViewName: Target view name, i.e., the current page view name.
- resViewType: Target view type, i.e., the current page view type.
- maskName: Backend-configured master page name.
- layoutName: Backend-configured layout name.
- DSL: All unprocessed metadata information returned by the current page.
- Layout: Layout data used by the current page. When the
layoutNameattribute is absent, this data comes from the frontend-registered Layout. - Mask: Master page data used by the current page.
- Page Fields: All field metadata information of the current page (excluding referenced views).
- Page Actions: All action metadata information of the current page (excluding referenced views).
- Runtime View: View metadata information of the current page.
- Runtime DSL: Parsed DSL metadata information.
- Runtime Layout: Parsed layout information.
- Runtime Rendering Template: The complete template rendered in the main view area, i.e., the final result of merging Layout and DSL.
- Complete Context: All contents in the runtime context.
Overview of API Debugging Information
- API Debugging: Used to initiate a
fetch formatbrowser request.- Log Level: Returns more or less debugging information according to different log levels (not yet supported).
- Initiate Request: Paste a
fetch format requestinto the input box below to initiate a real API call (using it in a production environment may generate data; ensure the API is idempotent and use it in an environment where test data is allowed). - Reset: Restores all contents of the API debugging page.
- API Response Result: Complete API return result.
- Request Information: Basic information and performance information of the current request.
- URL: URL of the debugging request.
- Request Method: HTTP request method of the debugging request.
GET/POST. - Total Request Time: Time from when the debugging request is sent to when the frontend response is parsed.
- Connection Time: Time to establish the HTTP request connection.
- Request Time: Time from when the debugging request is sent to when the browser responds.
- Response Time: Time from when the browser responds to when parsing is complete.
- Exception Code: Error code of the first exception information in the debugging request response result.
- Exception Message: Error message of the first exception information in the debugging request response result.
- Request Headers: HTTP request header information of the debugging request.
- GQL#{index}: A request may contain multiple GQLs initiated simultaneously and calling multiple corresponding backend functions, where
indexrepresents its corresponding sequence number.- GQL: GQL content
- Variables: GQL parameters
- Exception Stack: The first stack where an exception occurs in the request, i.e., the location of the exception (not returned if no exception).
- Business Stack: Call stack information excluding the Oinone stack.
- Business and Oinone Stack: Call stack information including the Oinone stack.
- All Stacks: Unprocessed complete stack information.
- SQL Debugging: All executed SQL used in the current request chain.
- Function Call Chain Tracking: Basic information and time consumption of all Oinone functions executed in the current request chain.
- GQL Context: Summary of the current GQL context.
- Session Context: All
PamirsSessioncontext information from the current request chain to its end. - Function Information: Information about the function called by the current GQL.
- Model Information: Summary information of the model corresponding to the function called by the current GQL.
- Environment Configuration Information: Server environment configuration information.
- {GQLNamespace}#{GQLName}: Response result of the currently executed function.
(Ⅲ) Initiating an API Debugging
The following examples are demonstrated in the Chrome browser, and there may be differences in other browsers.
1. Using the Browser to View APIs and Check API Exceptions
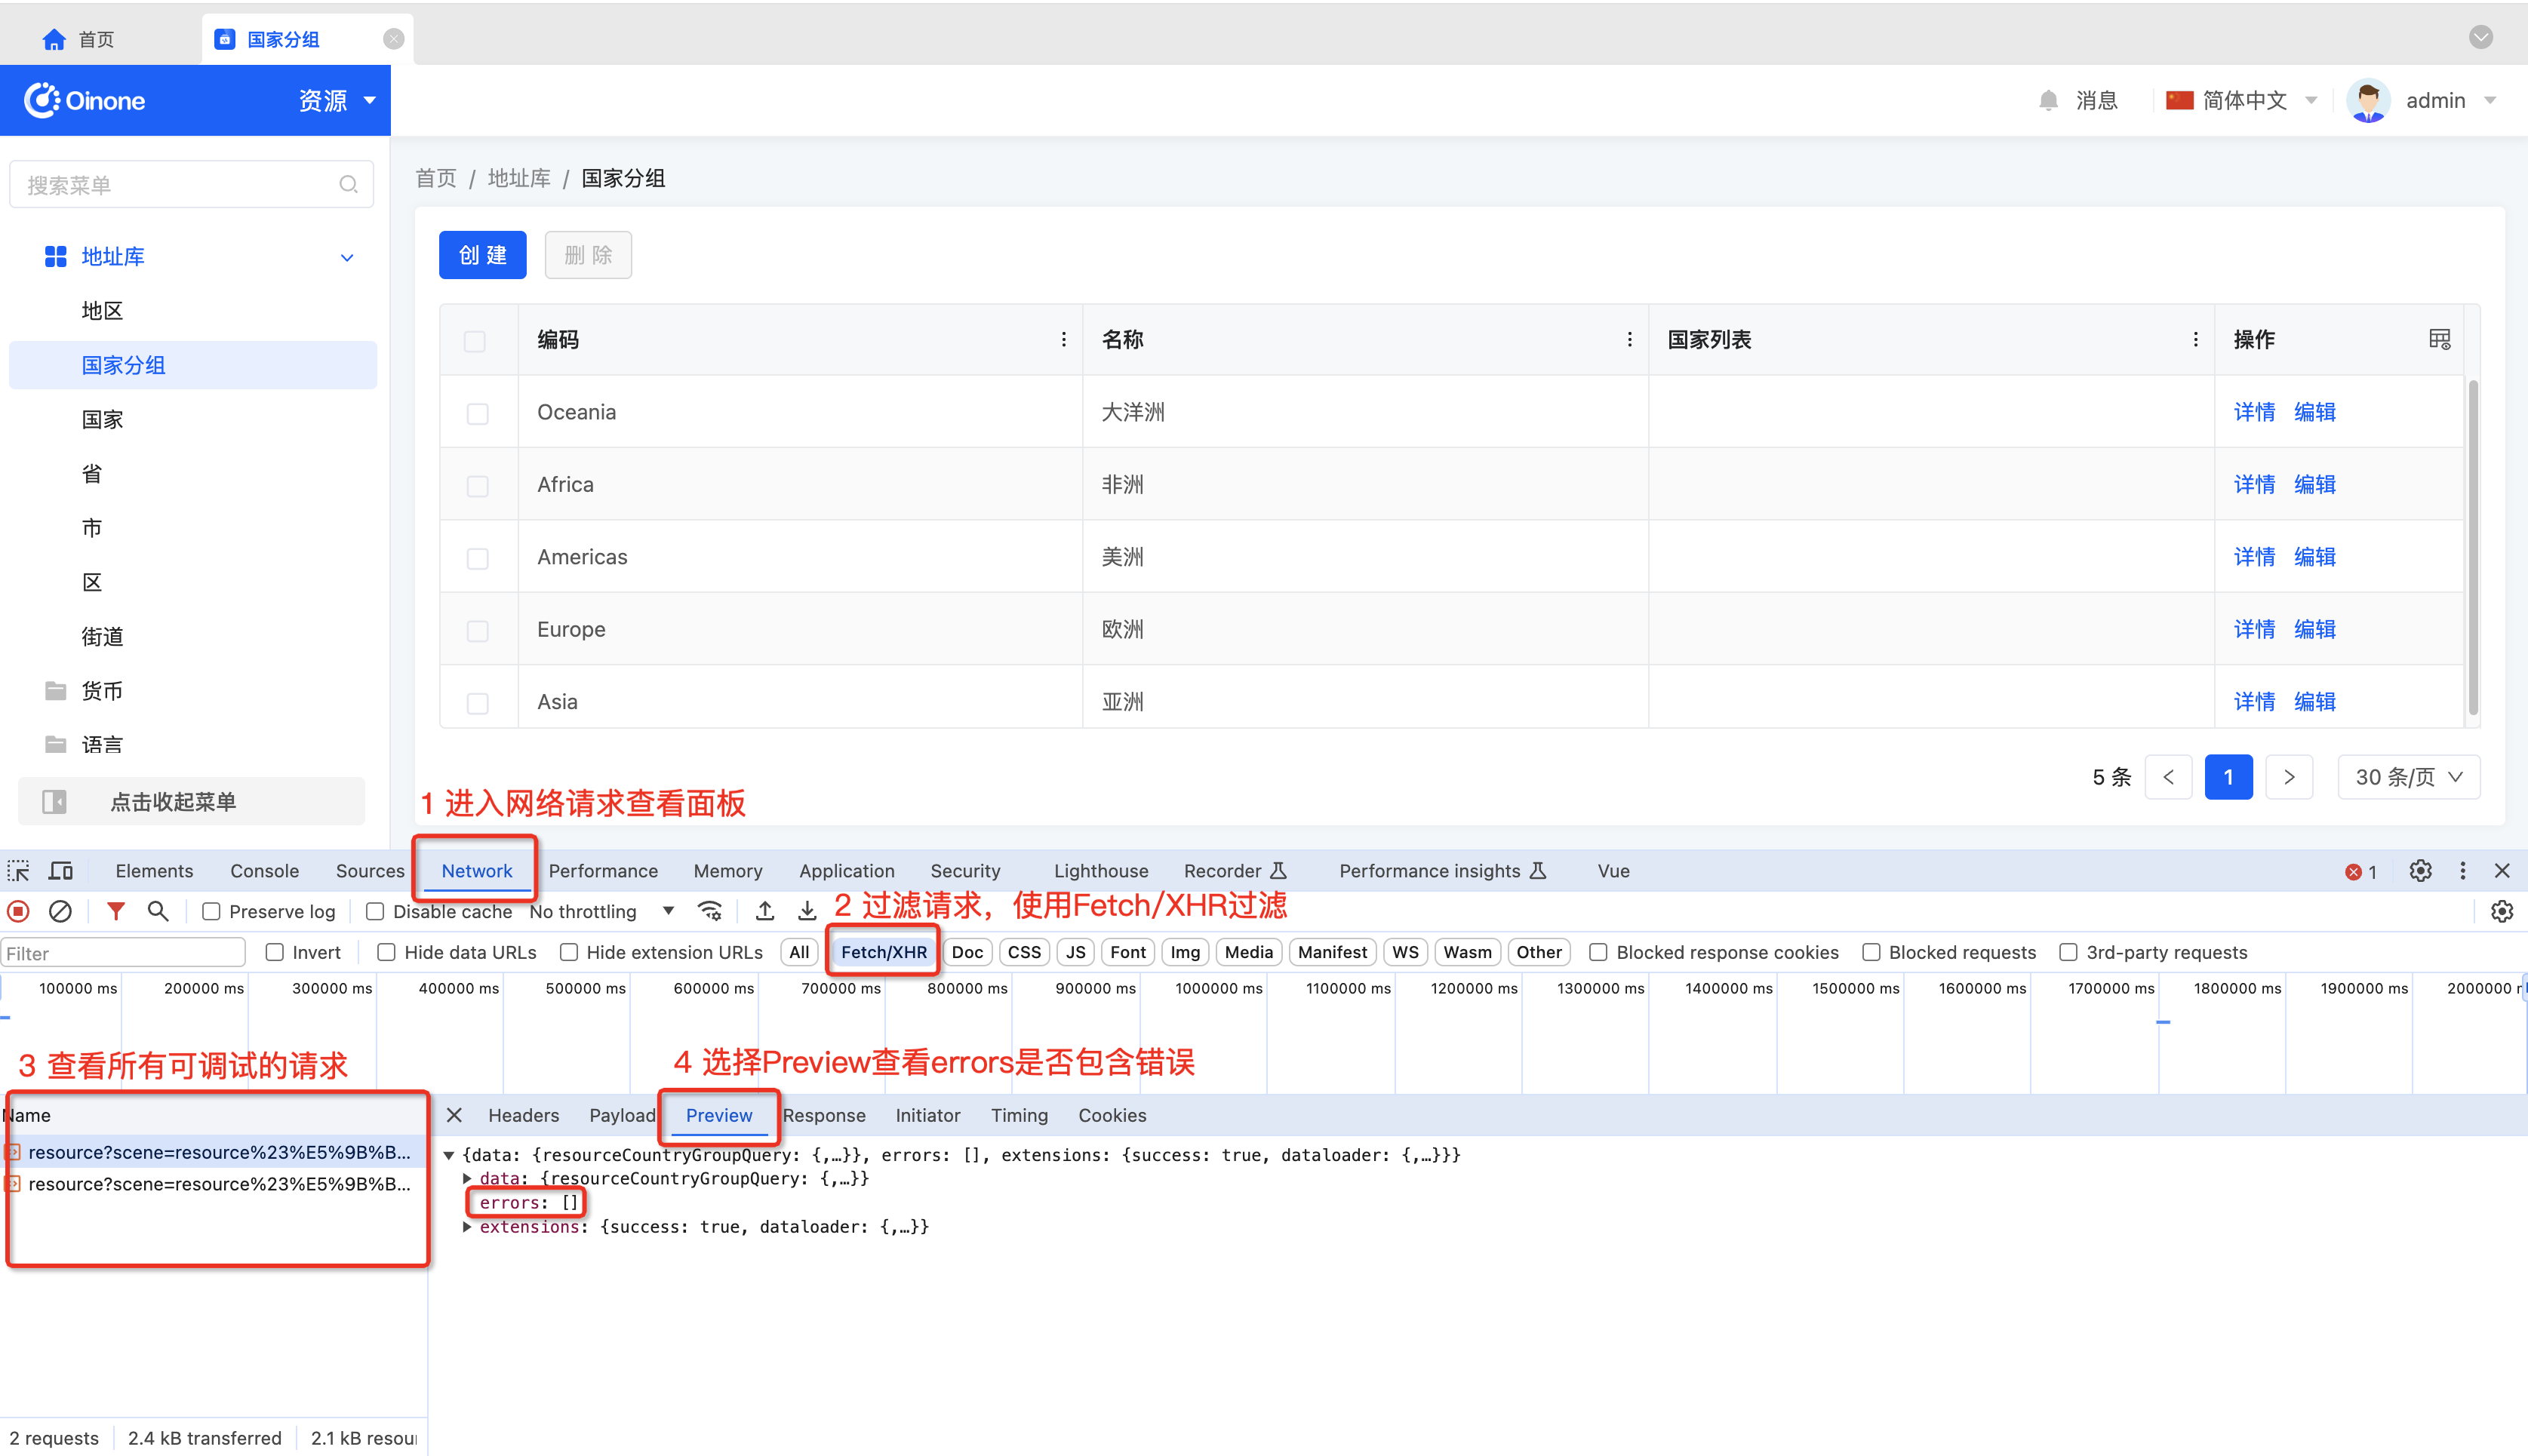
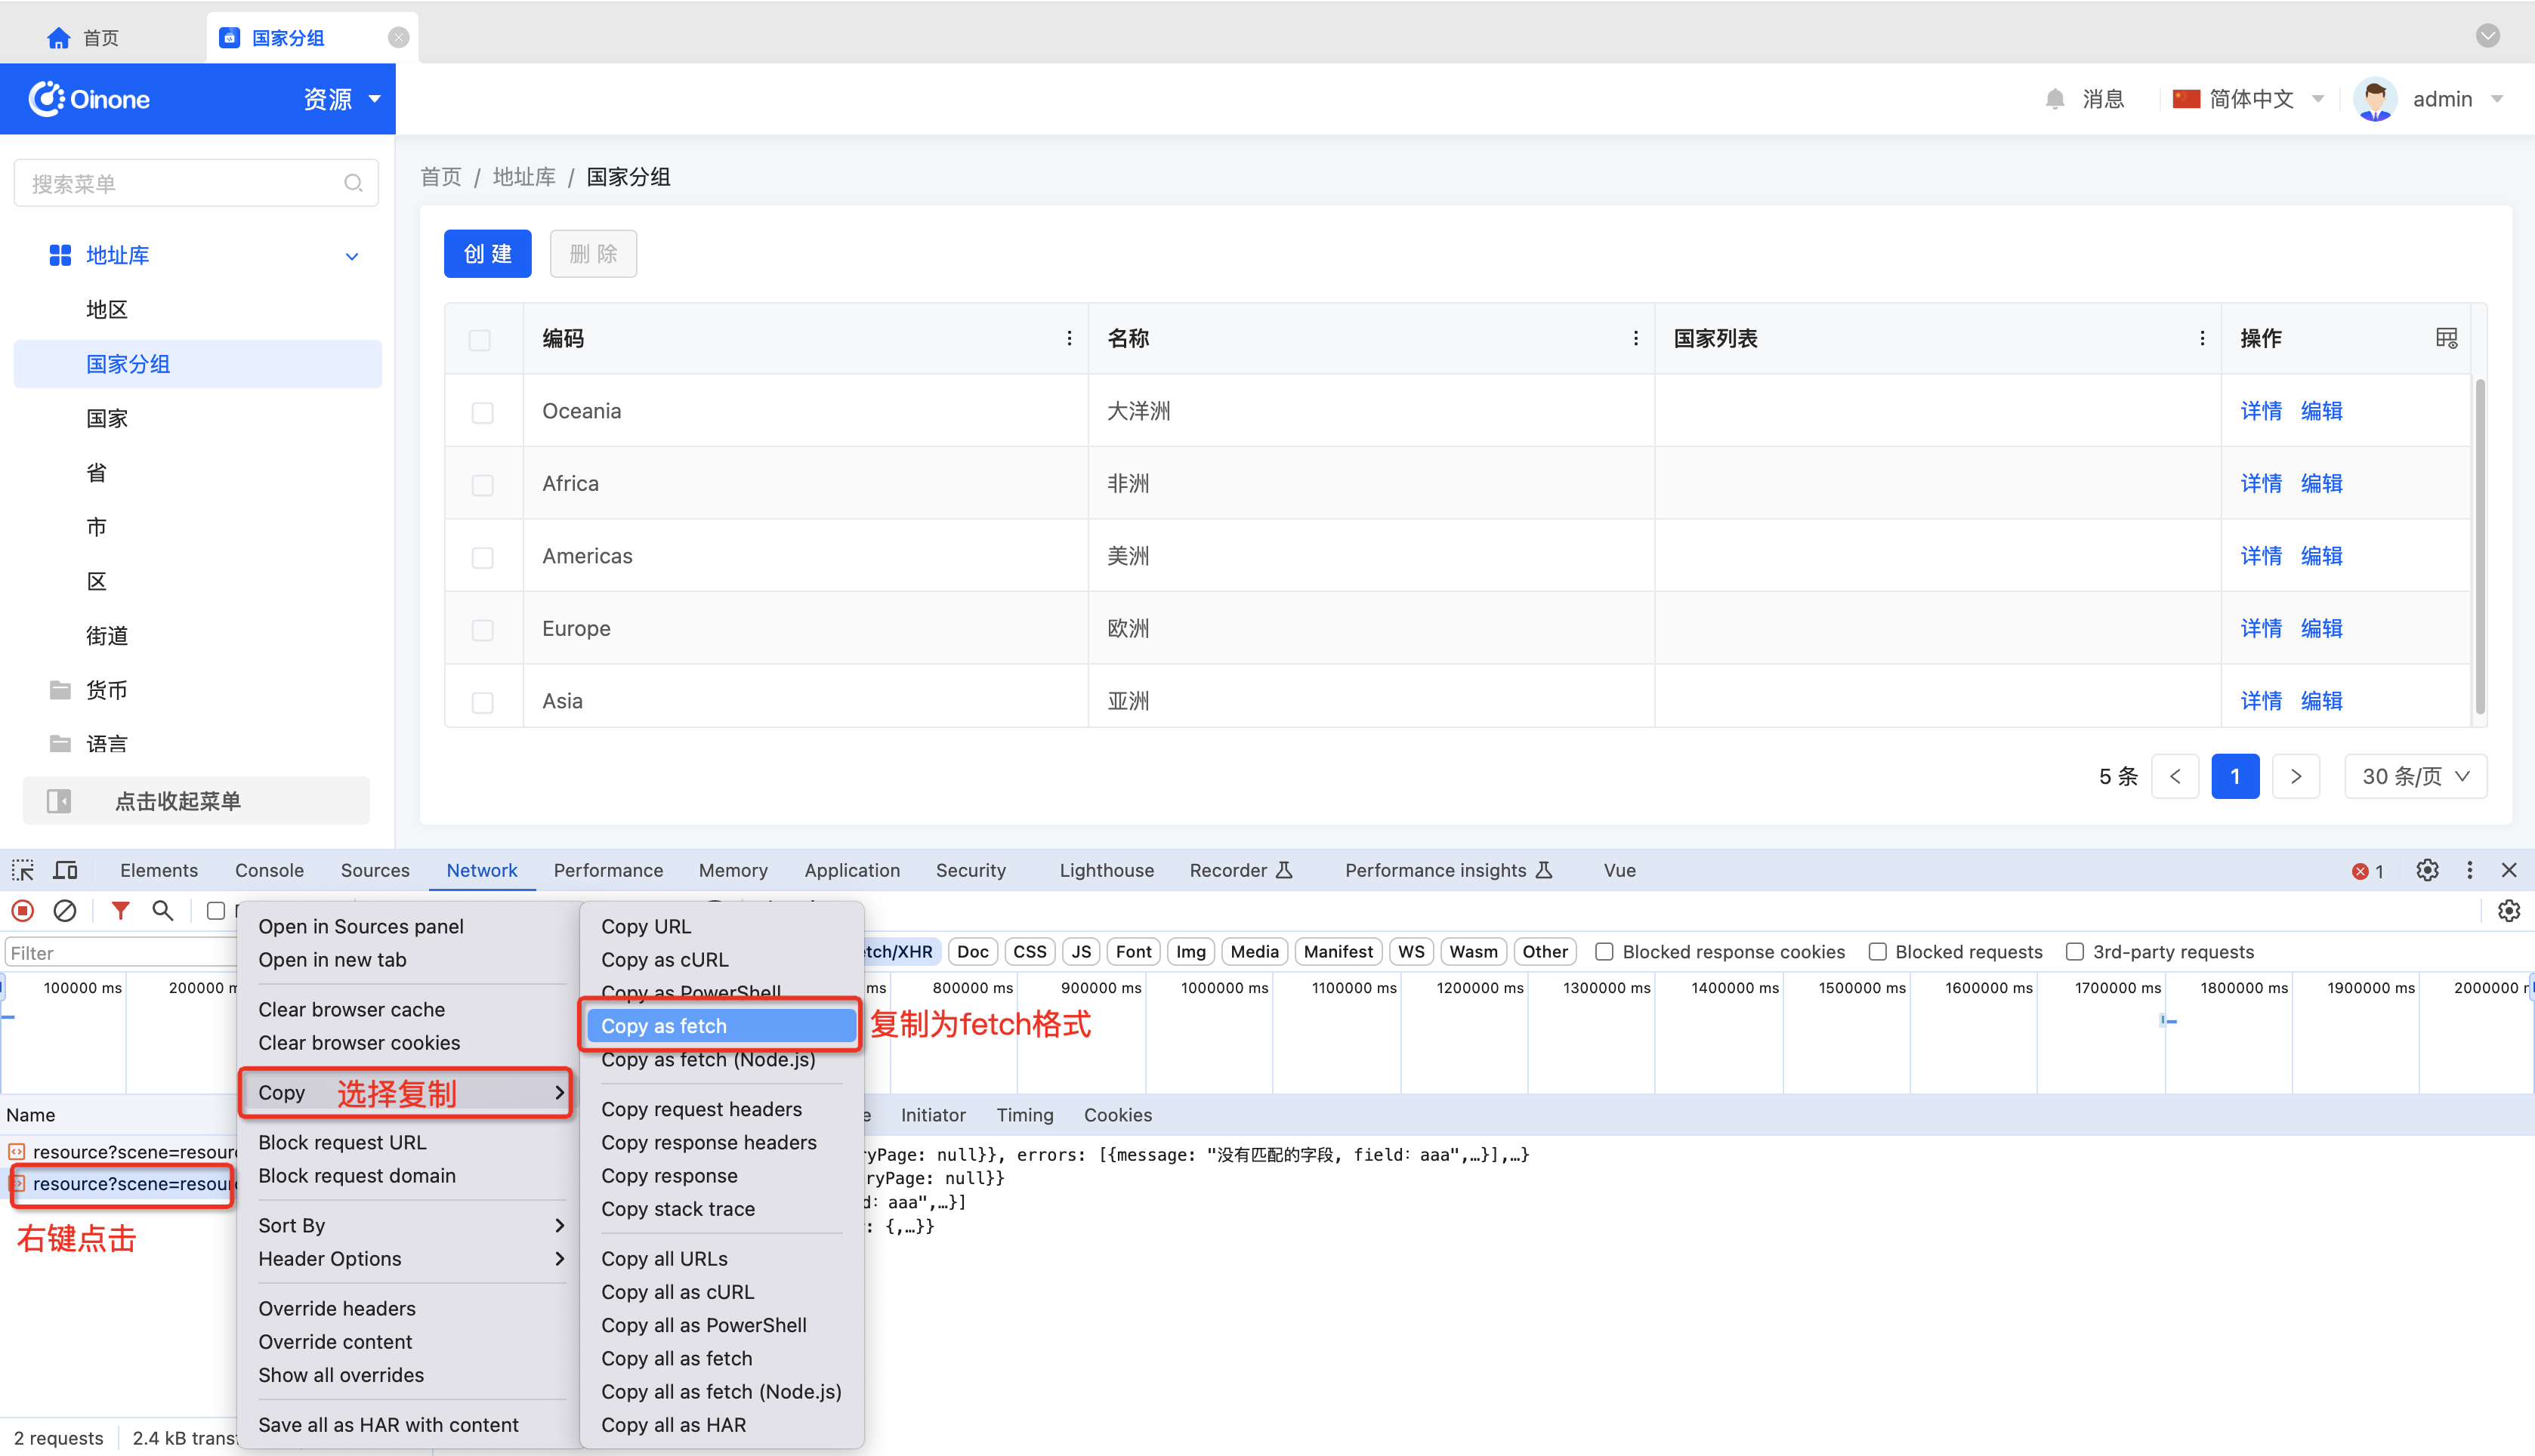
As shown in the following figure, open the browser console through Inspect or F12 and view all API requests:
- No Exception API
- API with Exception
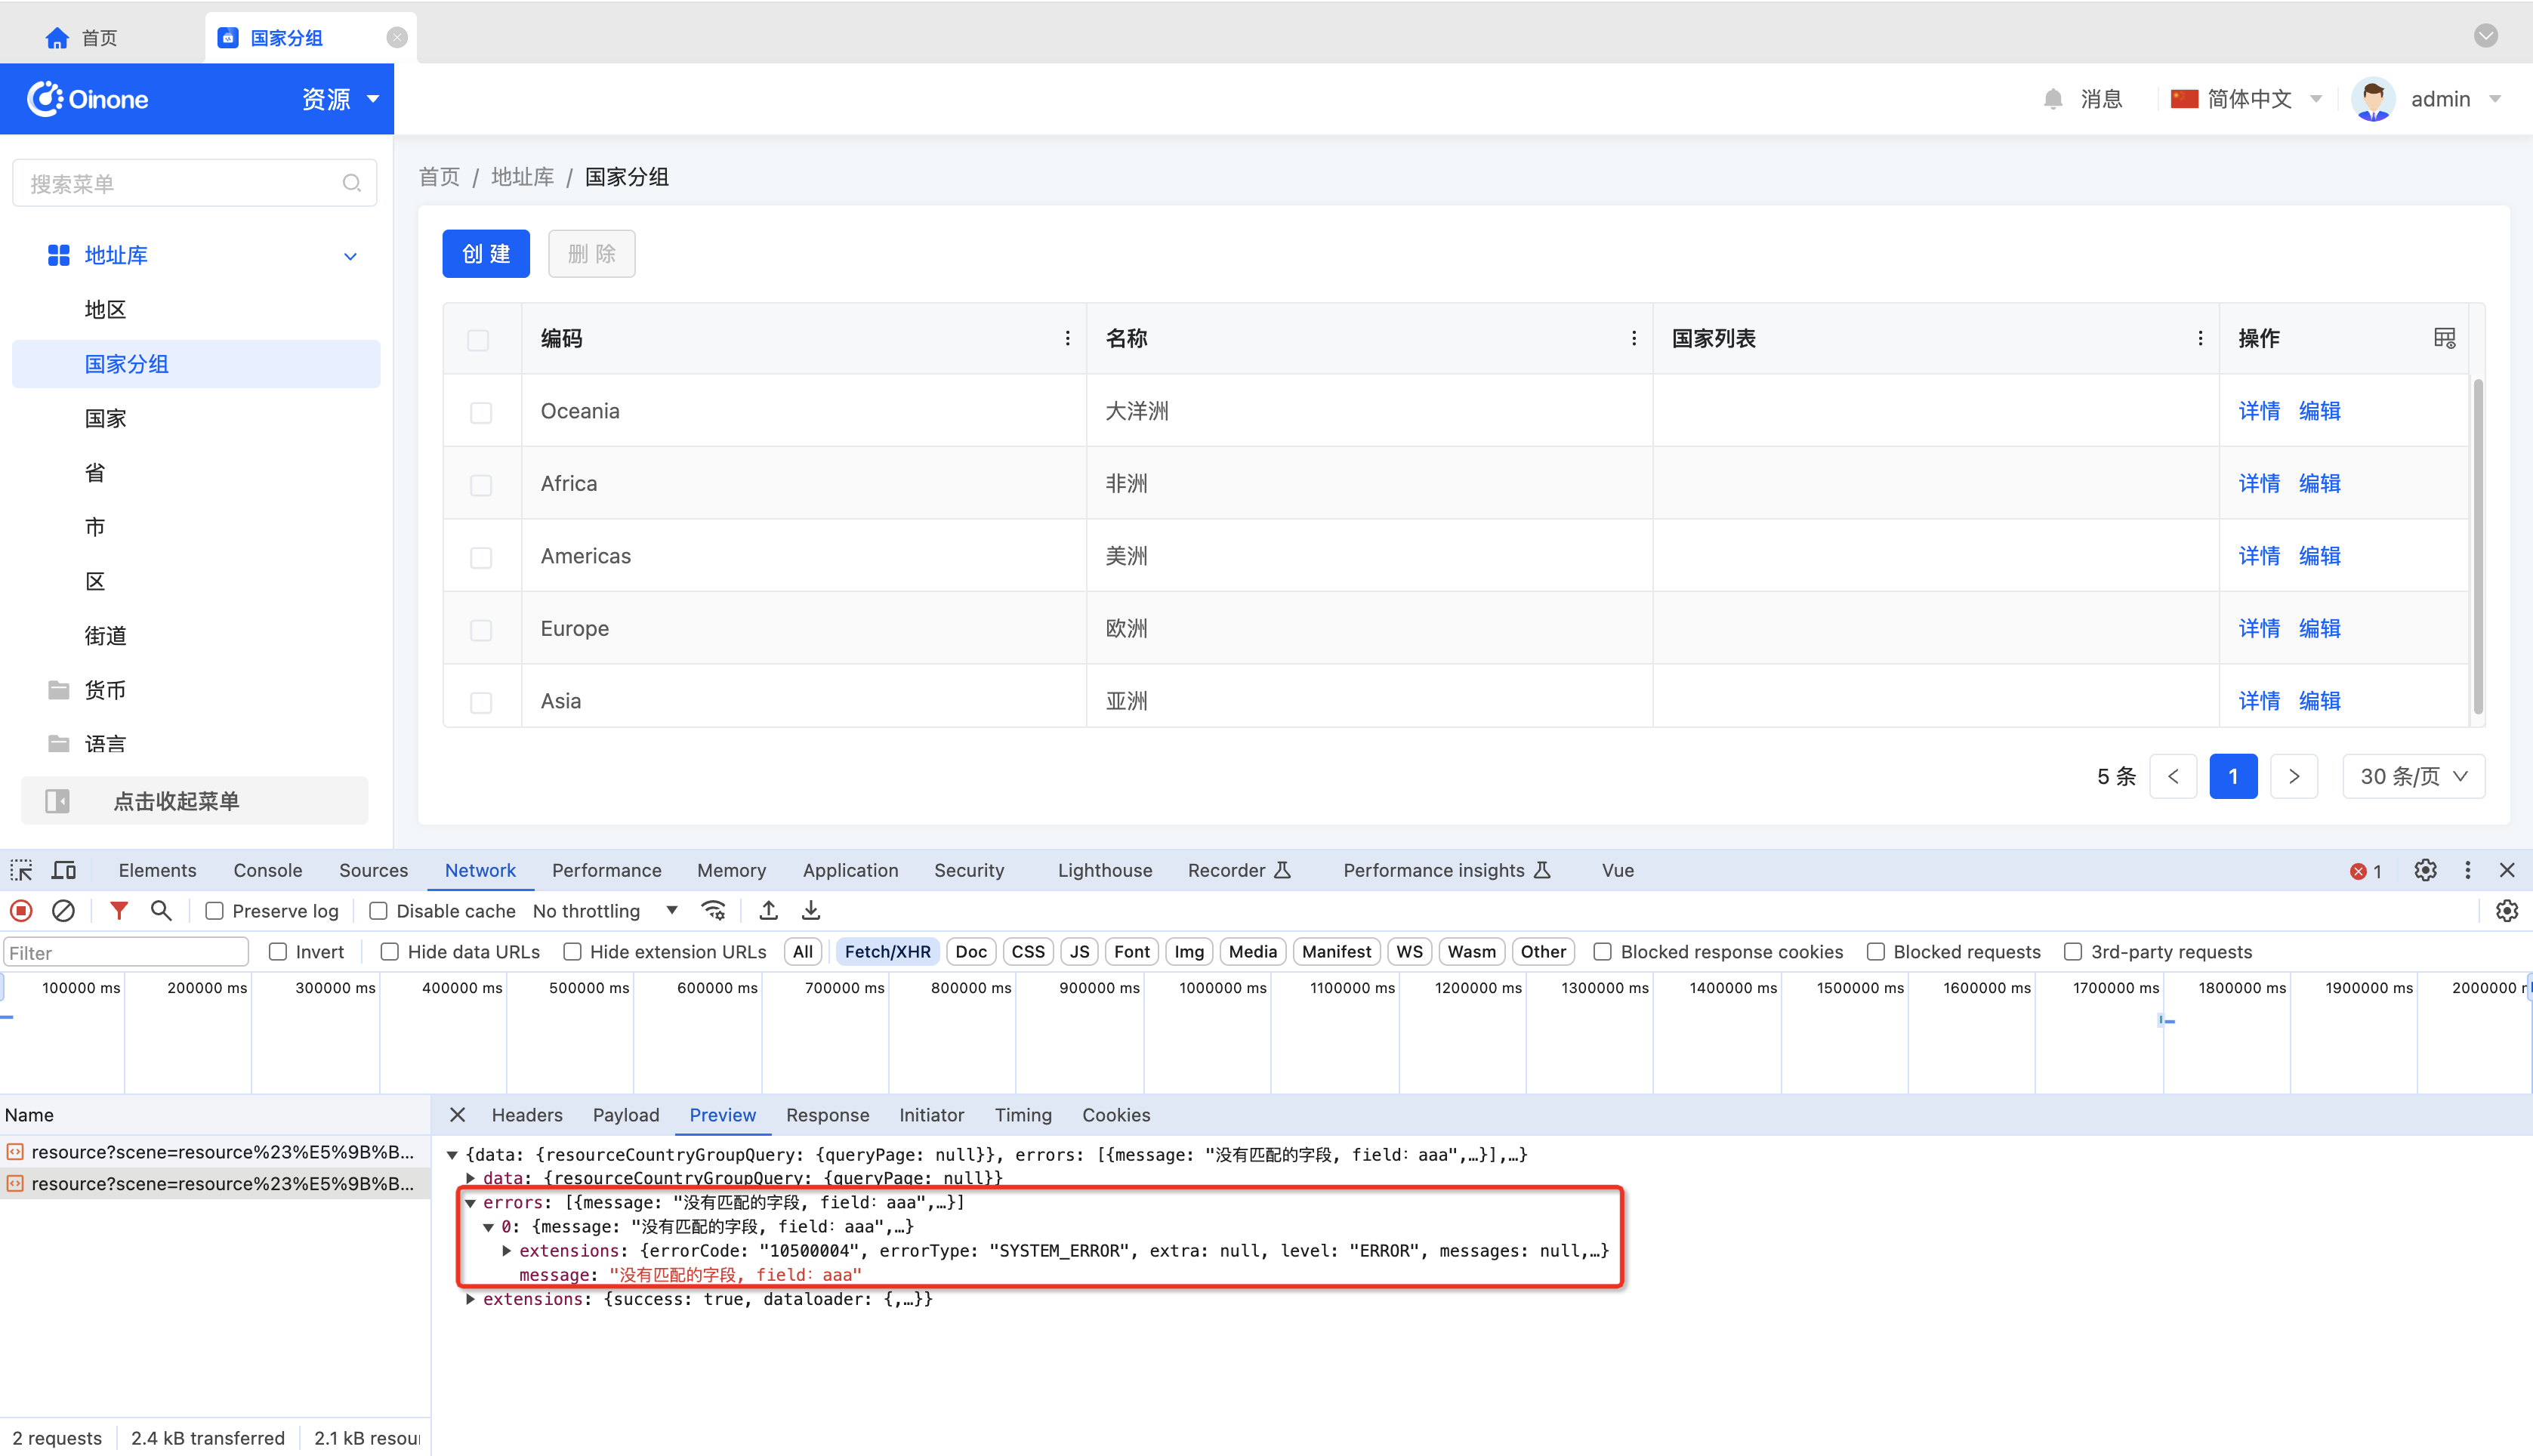
Tip:
Generally, the HTTP status of all Oinone requests is 200, and error information is returned in the errors array.
2. Copying the fetch Format Request in the Browser Console
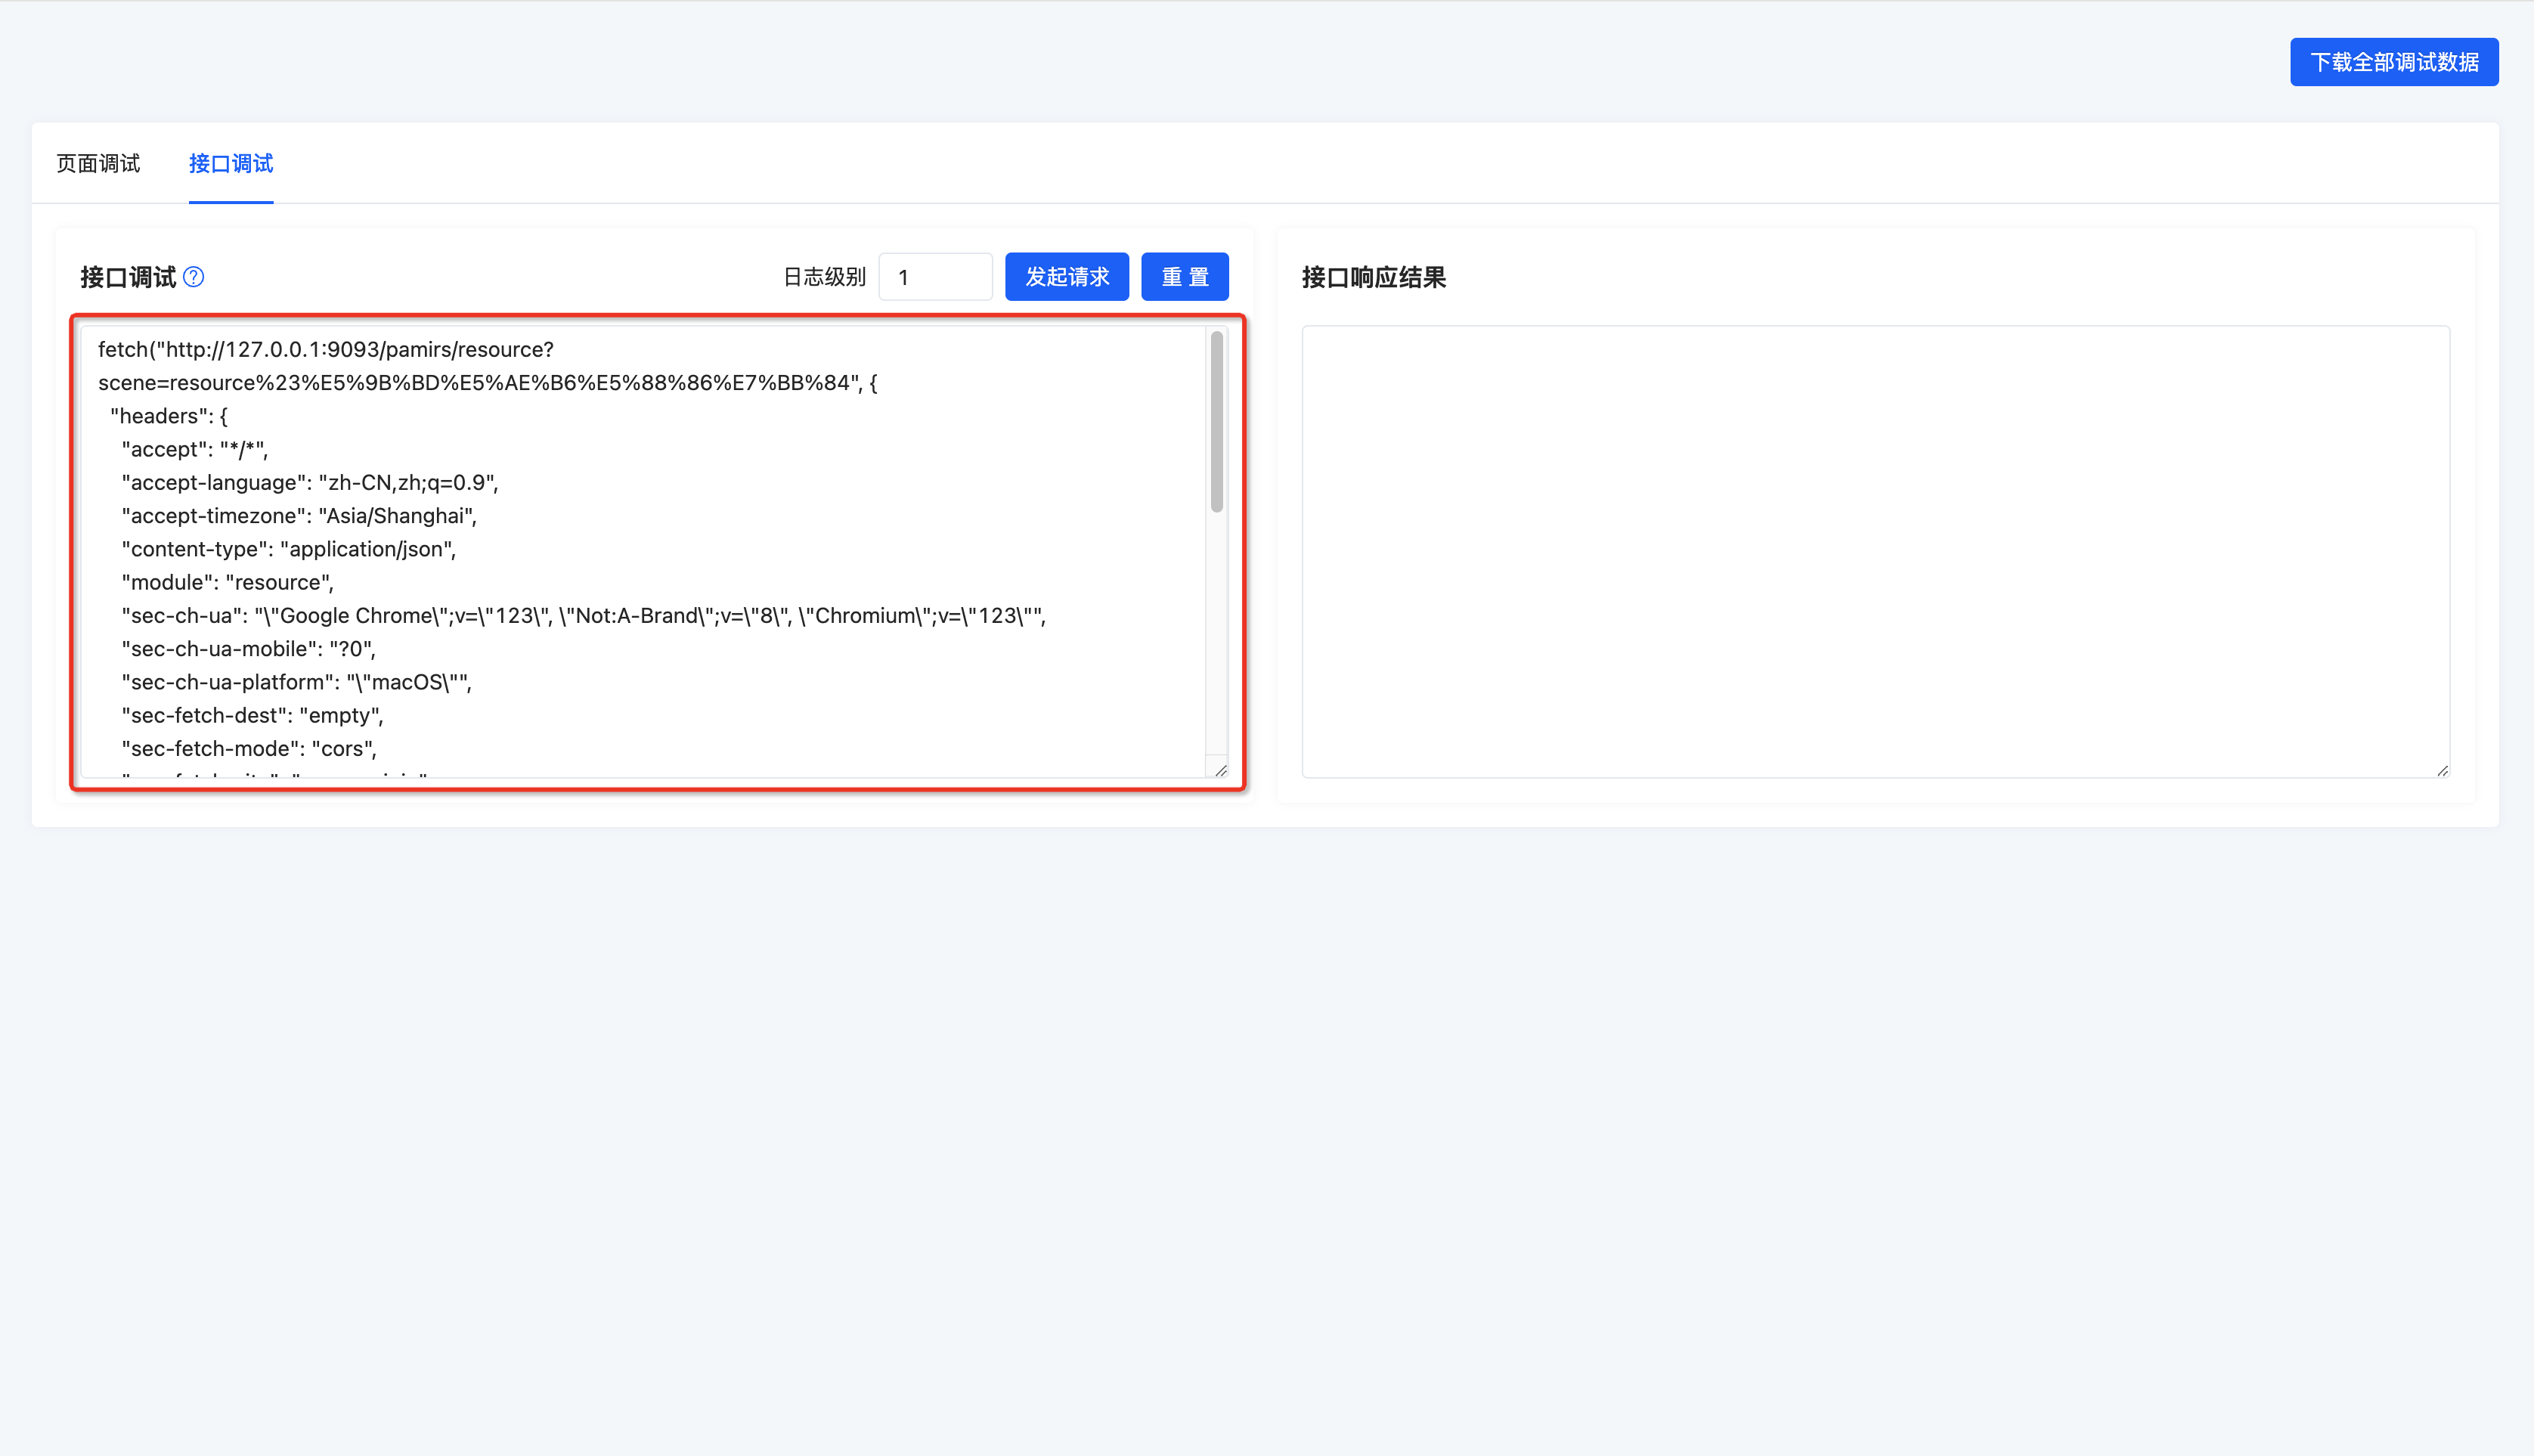
3. Pasting into the API Debugging Input Box
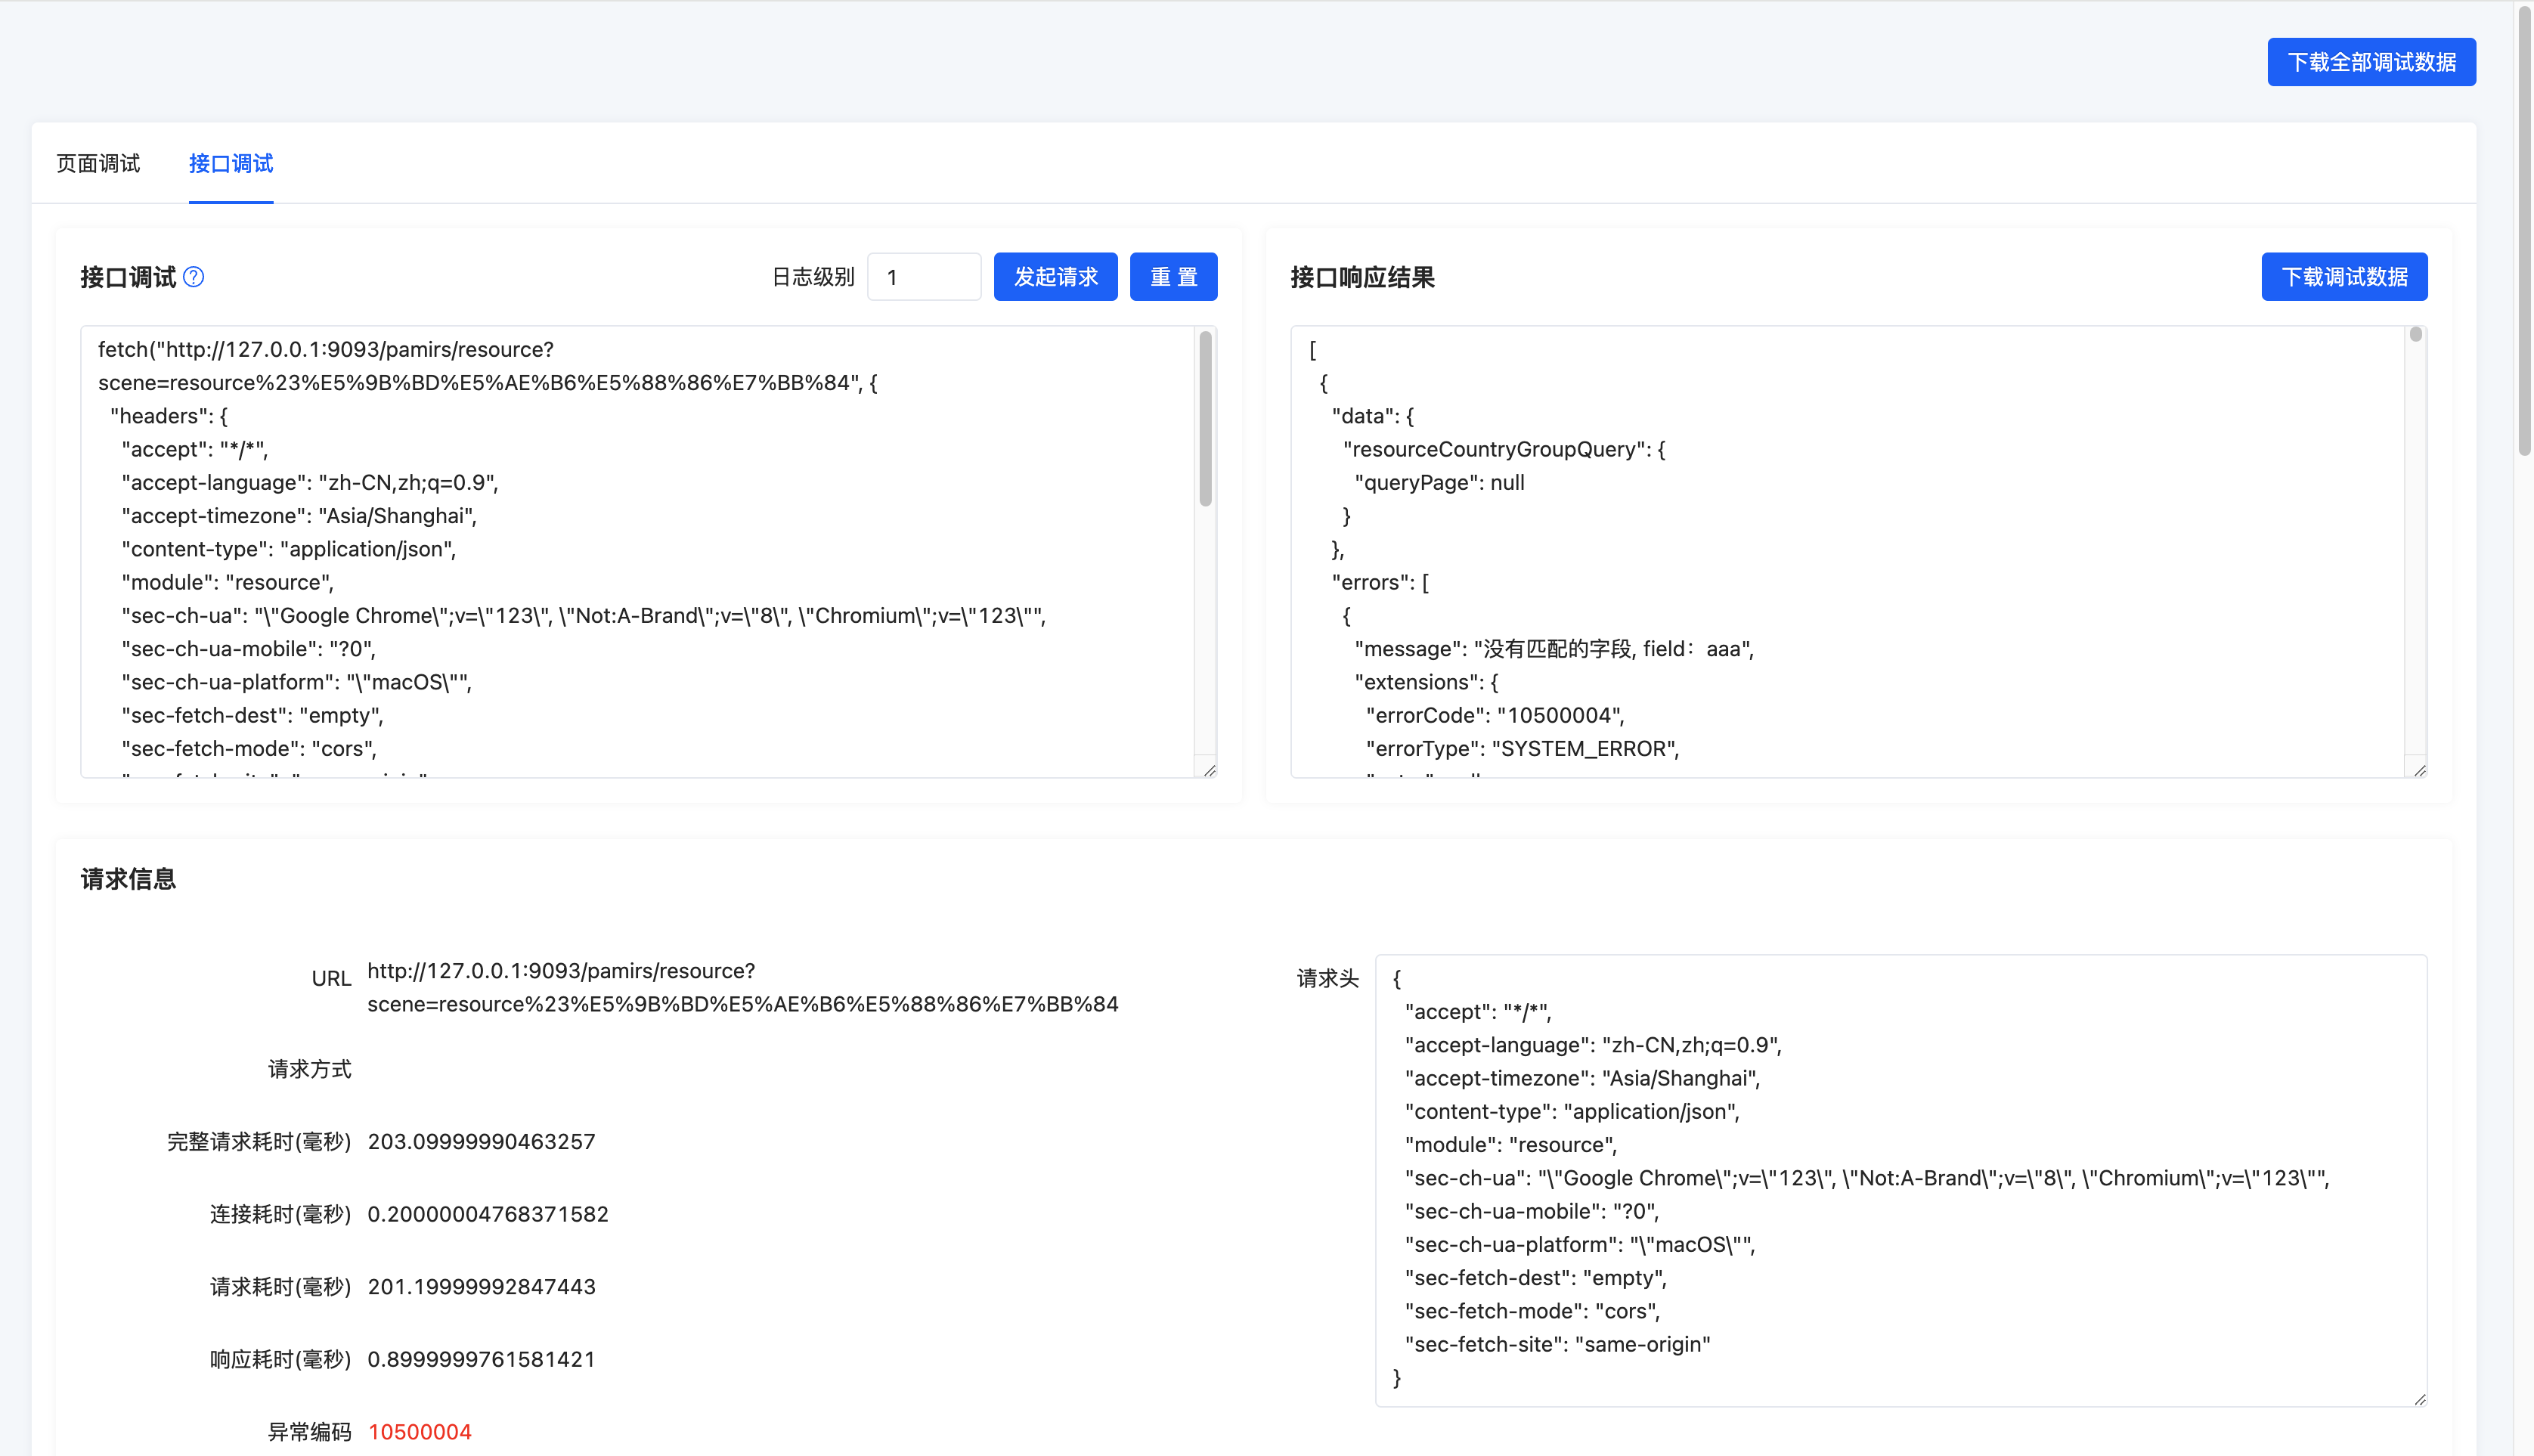
4. Click Initiate Request to See the Response Information of the API
So far, we have fully introduced the use of the existing debugging tool and basic explanations of the page display contents. In the future, we will continue to supplement and improve this debugging tool based on the content that needs debugging, striving to help developers efficiently locate common issues encountered during development.
Next, we will provide several simple scenarios and steps for viewing debugging information to help developers quickly get started with and use the debugging tool.
III. Debugging Scenarios and Inspection Steps
Generally, issues encountered on the Oinone platform can be easily located through the inspection steps listed in the following debugging scenarios.
When issues cannot be located using the debugging tool, you can use the Download All Debugging Data or Download Debugging Data button to send the downloaded file to Oinone after-sales service engineers, along with a clear description of the issue. Oinone after-sales service engineers will propose solutions or fixes for the issue.
The following debugging scenarios do not distinguish between Page Debugging and API Debugging; developers need to judge based on the encountered issues which debugging tool to use to solve the problem.
(Ⅰ) Explanation of SQL Examples
Table names in SQL examples may differ from those in the developer's debugging environment. Developers need to find the corresponding database and data tables based on the SQL examples and execute the SQL. Parameters in SQL examples need to be adjusted according to the issues encountered by developers.
SQL examples do not include tenant isolation-related fields; developers need to supplement query conditions according to the operating environment.
{URL#model} indicates replacing with the model attribute value in the URL parameters, and developers can adjust other cases as needed.
(Ⅱ) When Fields/Actions on the Page Are Not Displayed Correctly
1. Check if the Current User Has Permissions for the Field/Action (super administrators can skip this step)
Using the Page for Inspection
Step 1: Go to the User module, view the role list configured for the user, and check if it includes the expected role. Step 2: Go to the Permissions module, view the permission configurations of all roles of the user, and check if they include the visibility permission for the field or access permission for the action.
Using SQL for Inspection
Step 1: Obtain the user ID based on the currently logged-in user (developers need to view it themselves in the user_pamirs_user table through the current logged-in user information) Step 2: View the role list configured for the user and check if it includes the expected role.
-- Check the role list configured for the current user
select id,name from auth_auth_role where id in (select role_id from auth_user_role_rel where user_id = {userId} and is_deleted = 0) and is_deleted = 0;Step 3: View field and action permission configuration information based on the role list
2. Check if the View Corresponding to the Current Jump Action Is the Required View
Step 1: Search for field/action-related information in the DSL of Page Debugging to see if it is returned correctly.
If correctly returned, check according to the following steps:
- Check if the
metadatais fully supplemented. - Check if the
invisibleattribute is executed as expected.
If not correctly returned, check the relevant content in the database according to the following SQL examples.
-- Check if the ViewAction corresponds to the expected view
select id,res_model,res_view_name from base_view_action where model = '{URL#model}' and name = '{URL#action}' and is_deleted = 0;

-- Check if the view's template contains fields/actions
select b.id,b.type,b.template from (select res_model,res_view_name from base_view_action where model = ''{URL#model}' and name = ''{URL#action}' and is_deleted = 0) a left join base_view b on a.res_model = b.model and a.res_view_name = b.name;