I. Overview
Oinone's debug tools are efficiency tools supporting direct page debugging and API debugging on browser pages. They integrate core debugging functions such as page metadata debugging, exception stack analysis, SQL execution tracking, and function chain monitoring, as well as business scenario debugging functions like permission verification tracking, permission context, and data audit tracking. These tools help front-end and back-end developers quickly locate and solve debugging needs in different scenarios, significantly improving development efficiency.
II. Accessing Debug Tools
Access the debug tools page by modifying the browser URL on the page to be debugged, as shown in the following figure:
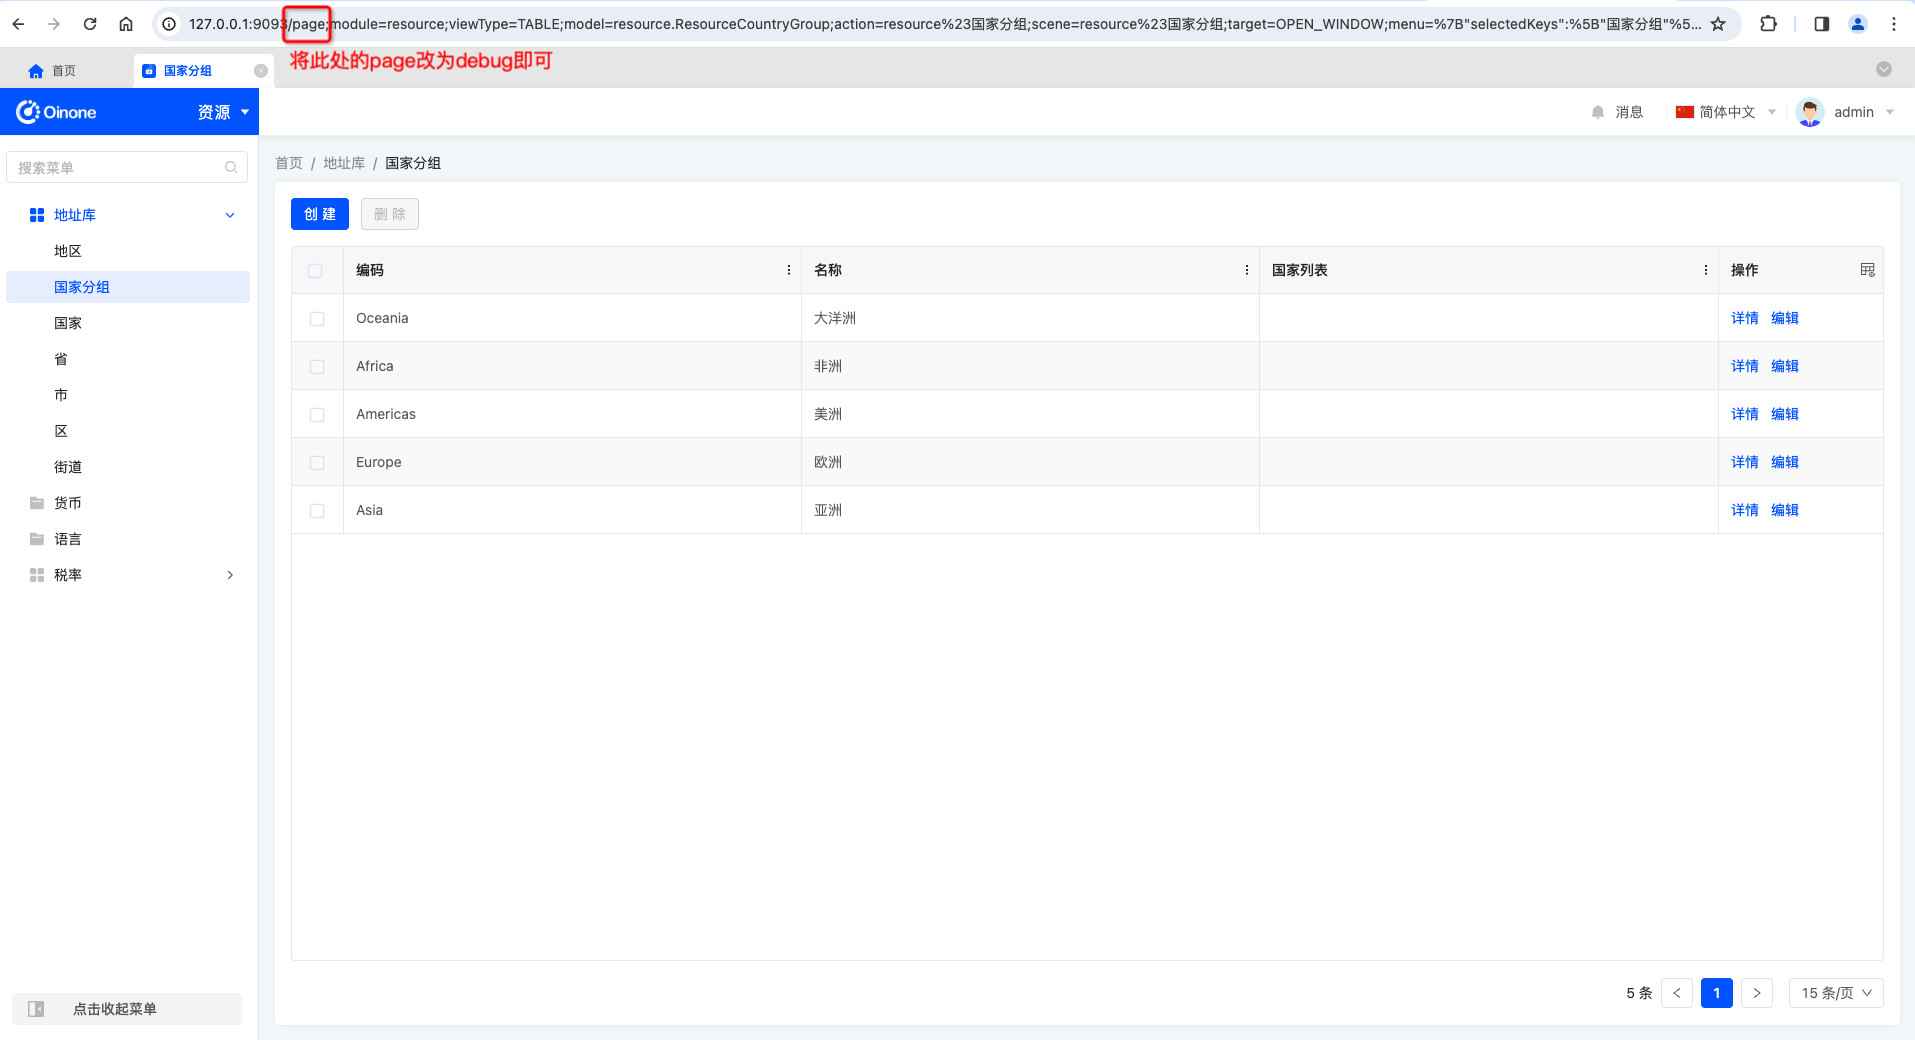
Suppose the URL of the page to be debugged is as follows:
http://127.0.0.1:9093/page;module=resource;viewType=TABLE;model=resource.ResourceCountryGroup;action=resource%23%E5%9B%BD%E5%AE%B6%E5%88%86%E7%BB%84;scene=resource%23%E5%9B%BD%E5%AE%B6%E5%88%86%E7%BB%84;target=OPEN_WINDOW;menu=%7B%22selectedKeys%22:%5B%22%E5%9B%BD%E5%AE%B6%E5%88%86%E7%BB%84%22%5D,%22openKeys%22:%5B%22%E5%9C%B0%E5%9D%80%E5%BA%93%22,%22%E5%9C%B0%E5%8C%BA%22%5D%7DChange page to debug to enter the debug page for this page, as shown below:
http://127.0.0.1:9093/debug;module=resource;viewType=TABLE;model=resource.ResourceCountryGroup;action=resource%23%E5%9B%BD%E5%AE%B6%E5%88%86%E7%BB%84;scene=resource%23%E5%9B%BD%E5%AE%B6%E5%88%86%E7%BB%84;target=OPEN_WINDOW;menu=%7B%22selectedKeys%22:%5B%22%E5%9B%BD%E5%AE%B6%E5%88%86%E7%BB%84%22%5D,%22openKeys%22:%5B%22%E5%9C%B0%E5%9D%80%E5%BA%93%22,%22%E5%9C%B0%E5%8C%BA%22%5D%7DPS: Typically, we paste the modified new URL into a new browser tab to keep the original page available for continuing to view relevant information.
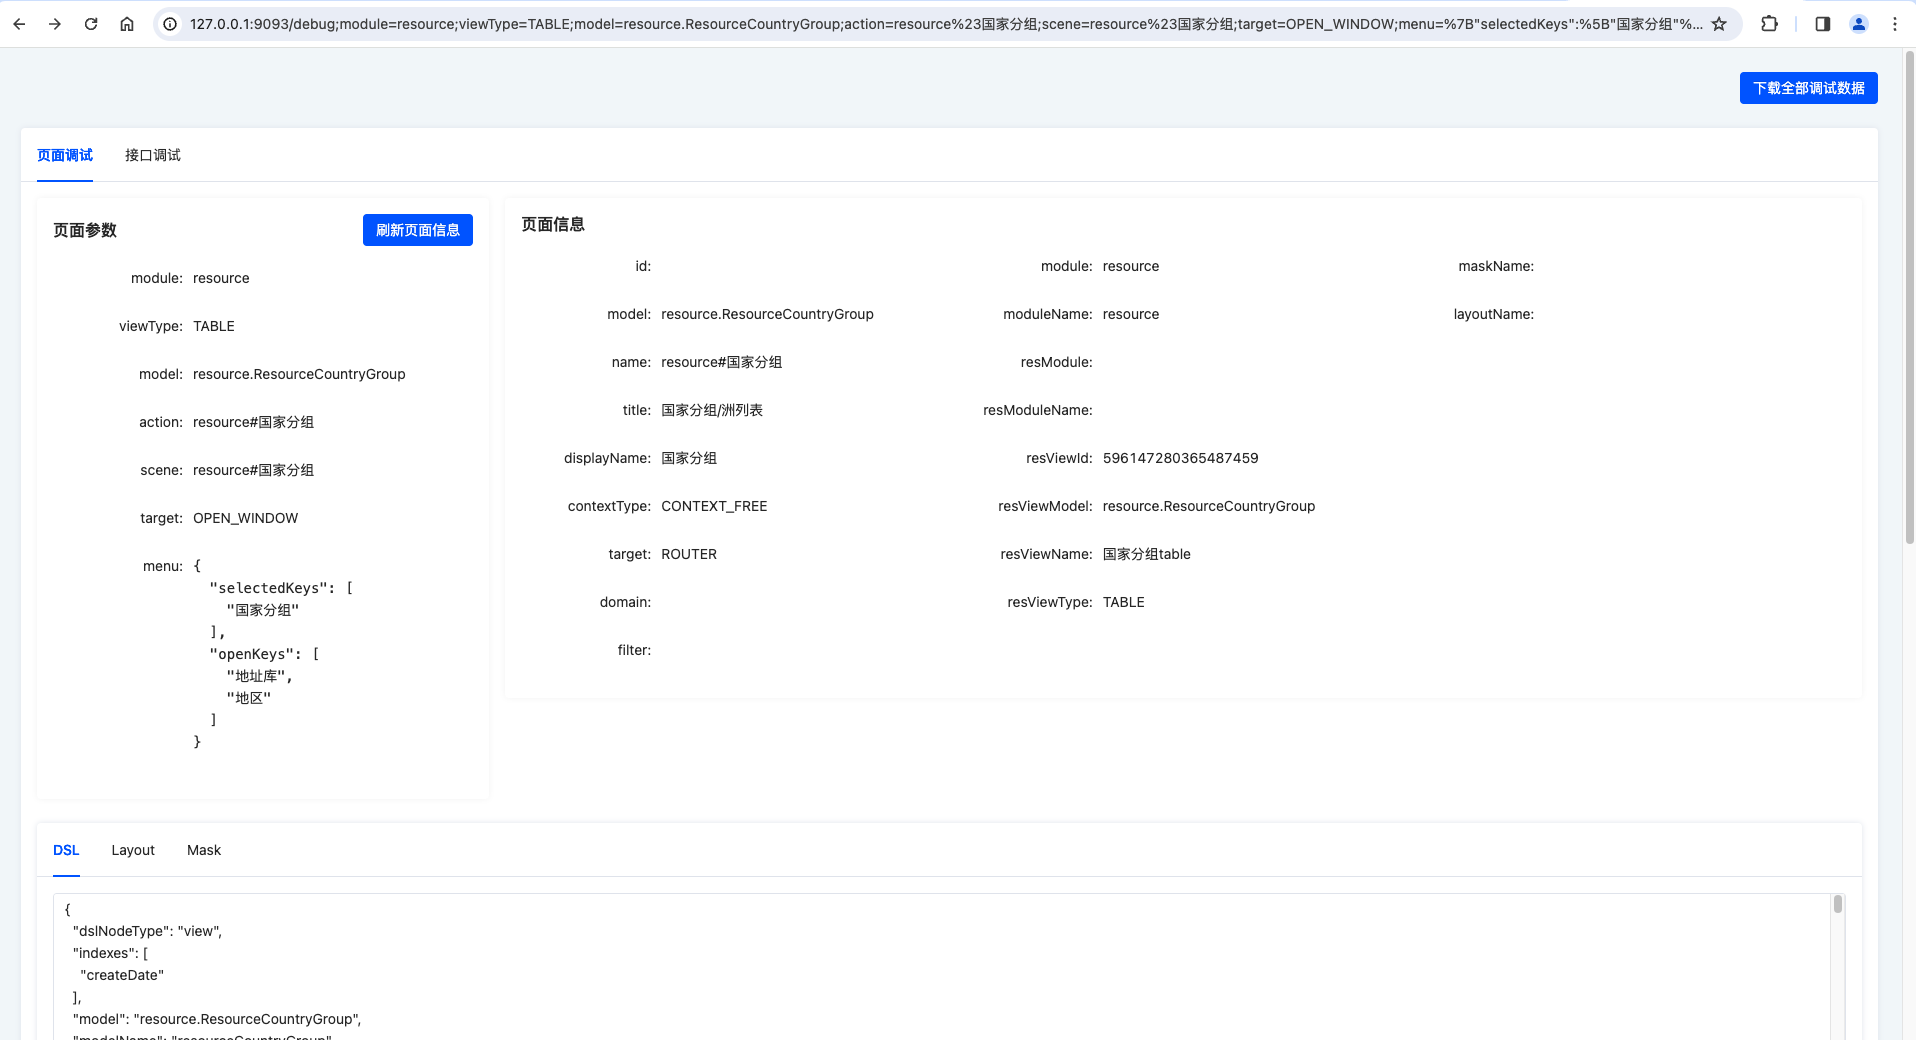
After entering the debug tools page, you will see a page similar to the following:
III. Page Debugging
After entering page debugging, you can intuitively view the following information:
- Page parameters: Parsed results of current URL parameters.
- Page information: Basic information of the navigation action returned by the
viewAction#loadAPI. - DSL: Metadata information used by the current page.
- Layout: Layout used by the current page.
- Mask: Template used by the current page.
Tip:
Page debugging requires no detailed explanation of excessive content; it mainly involves checking whether metadata such as "fields" and "actions" are returned as required by front-end components.
For example, component rendering errors due to unmet field registration conditions, component malfunctions due to incorrect attribute configurations, and out-of-order DSL returns.
IV. API Debugging
(Ⅰ) Initiating an API Debugging Session
The following examples are demonstrated in the Chrome browser, with possible differences in other browsers.
1. Viewing APIs and API Exceptions Using the Browser
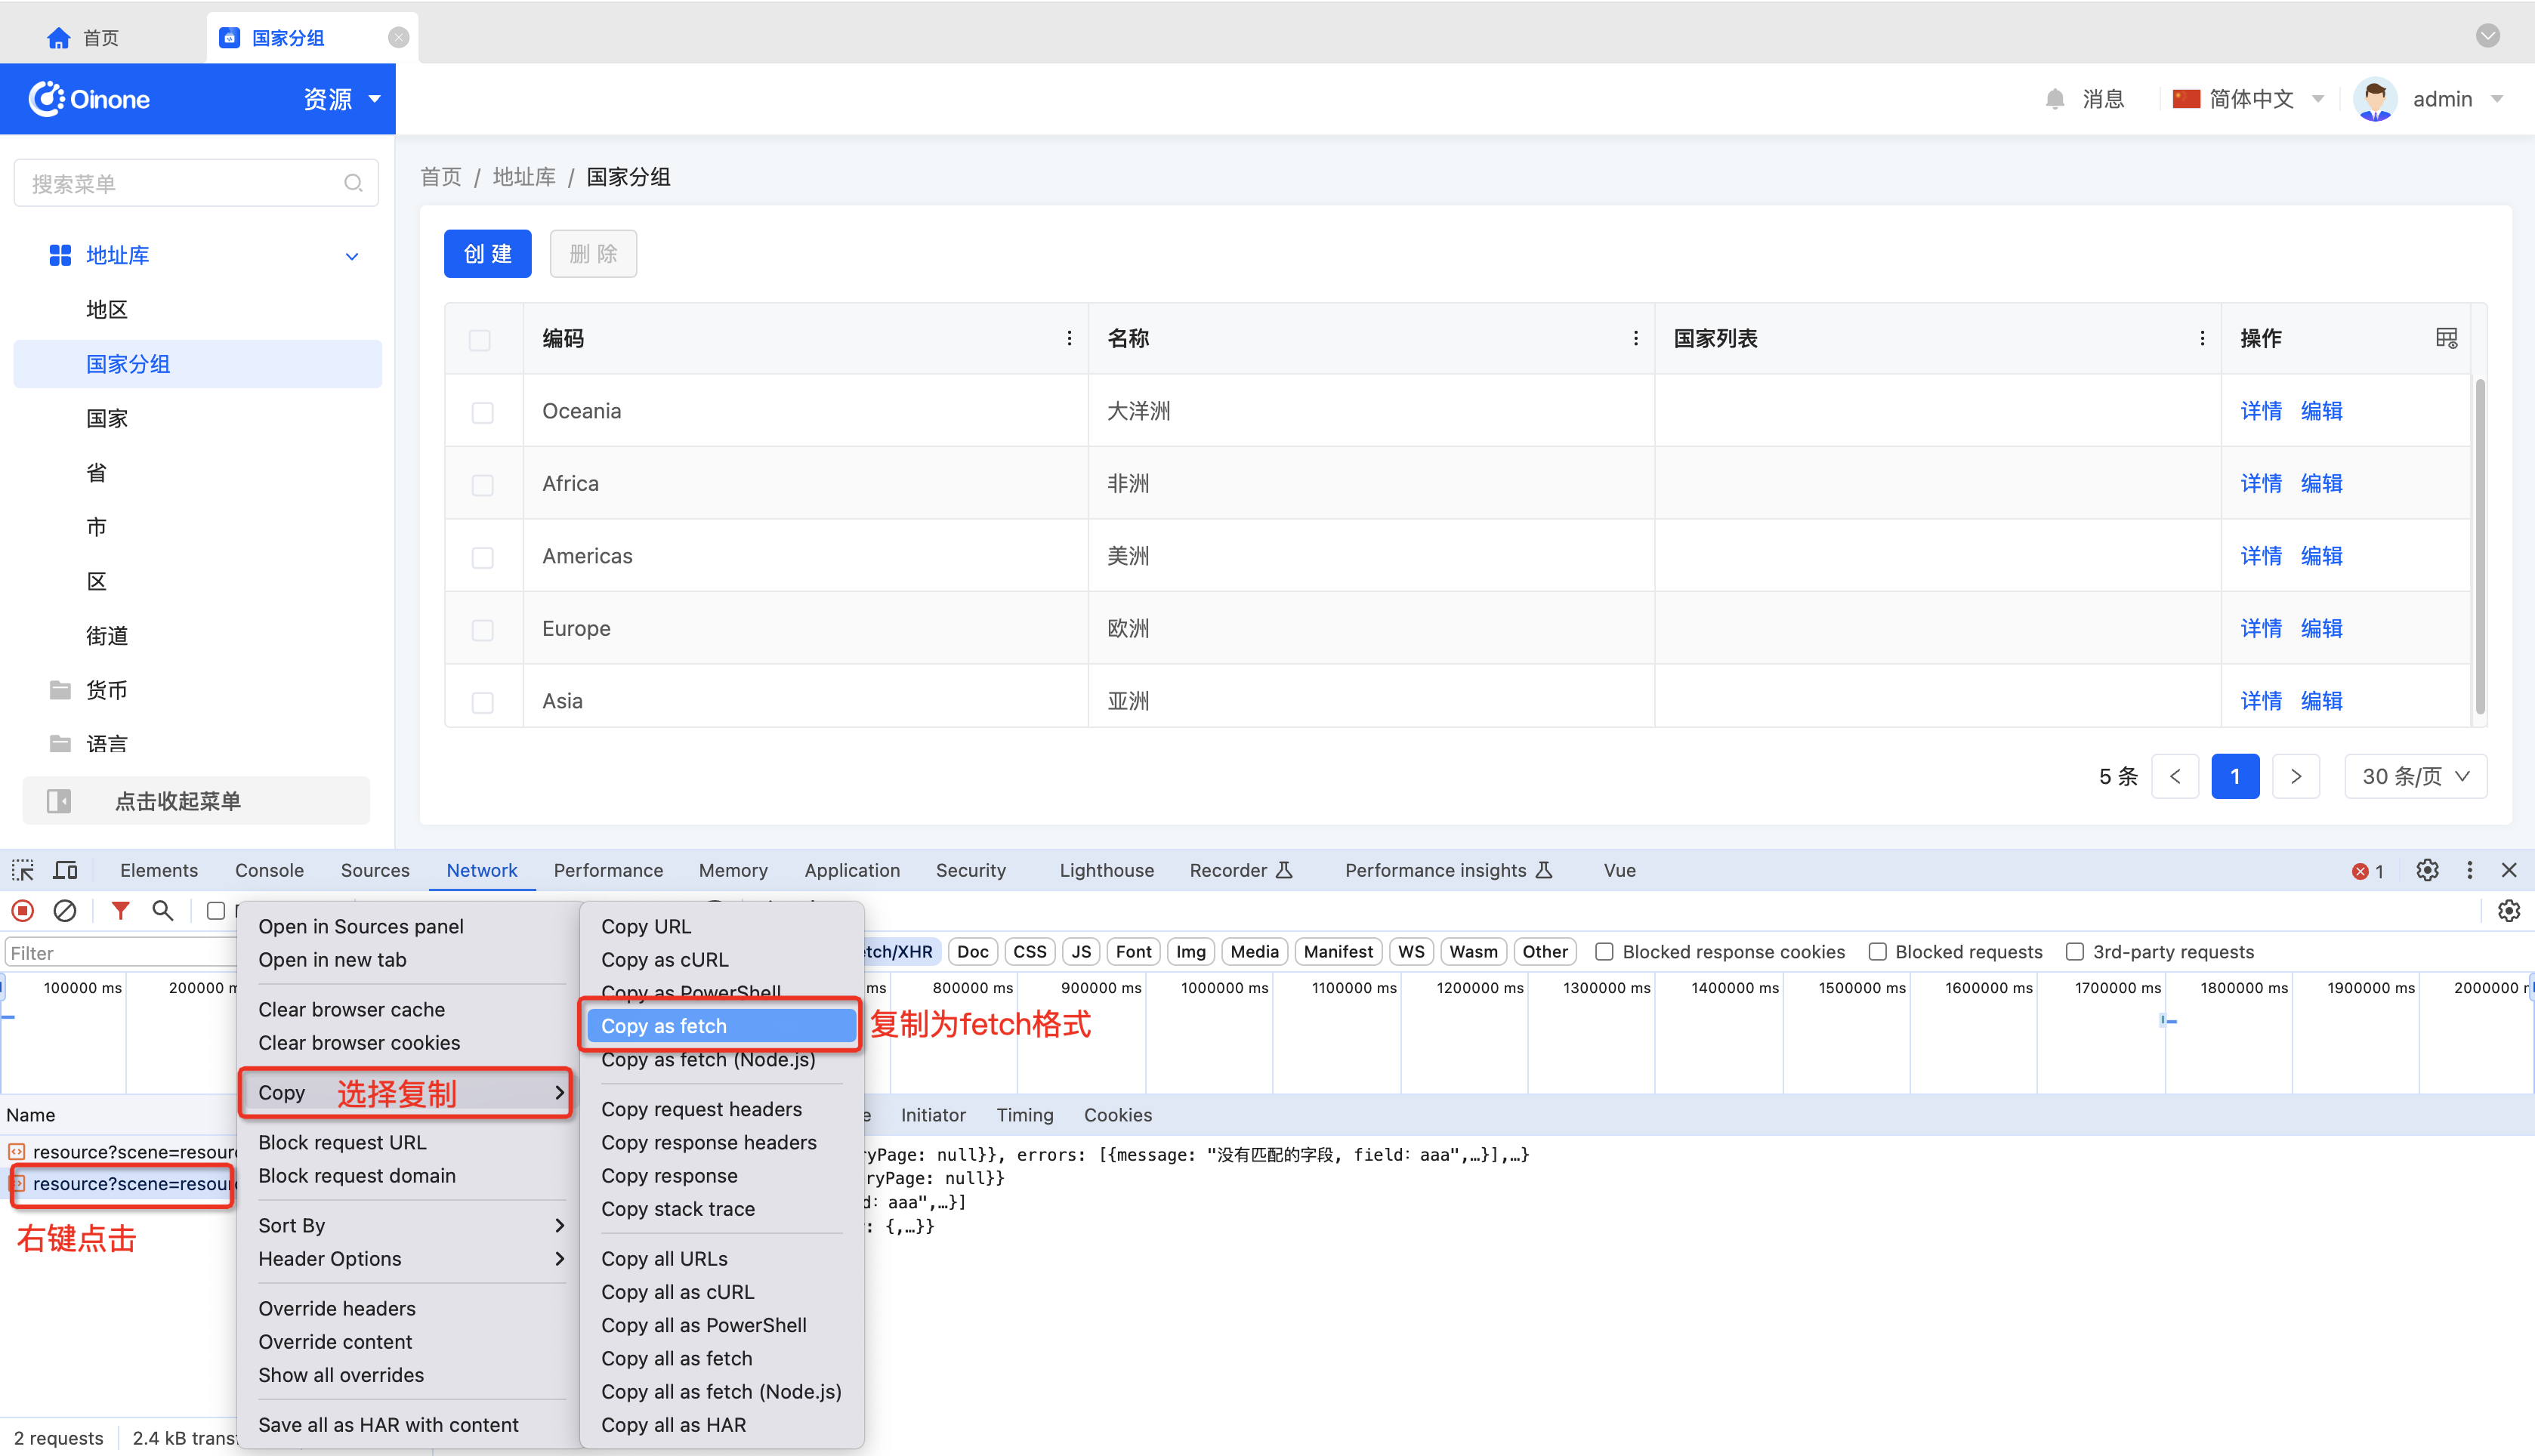
As shown in the figure below, open the browser console via Inspect or F12 and view all API requests:
Non-exceptional API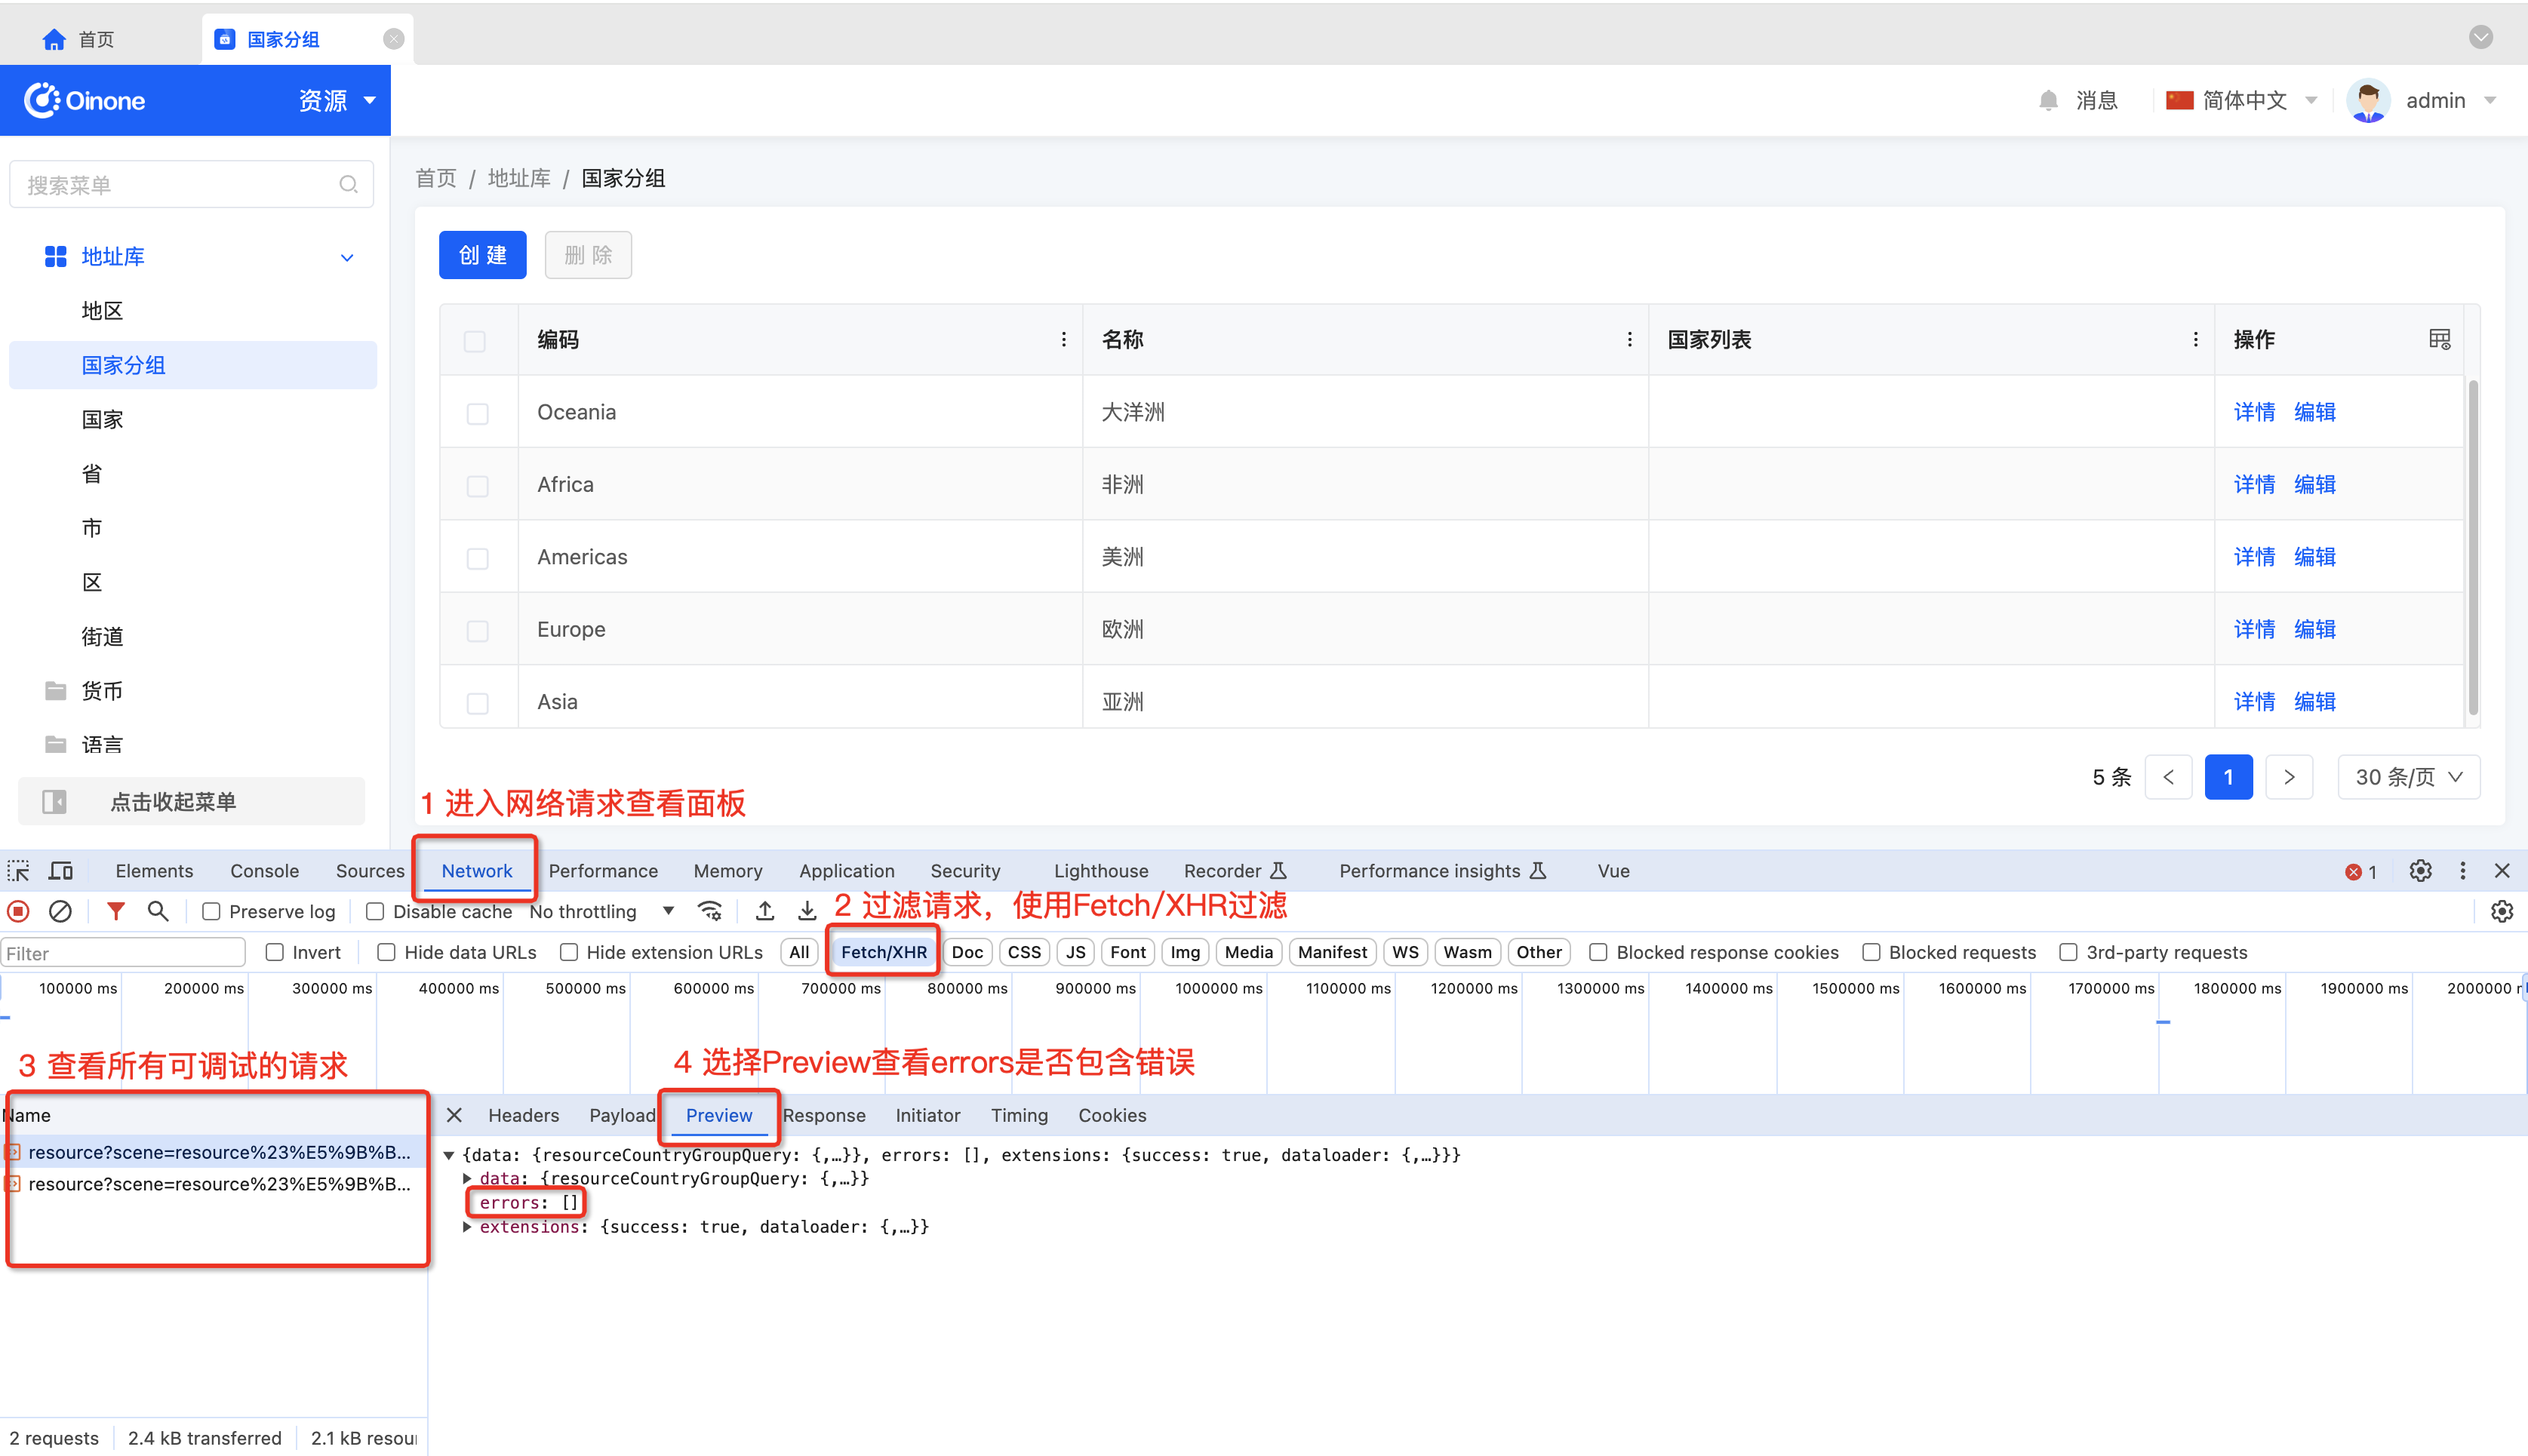
Exceptional API
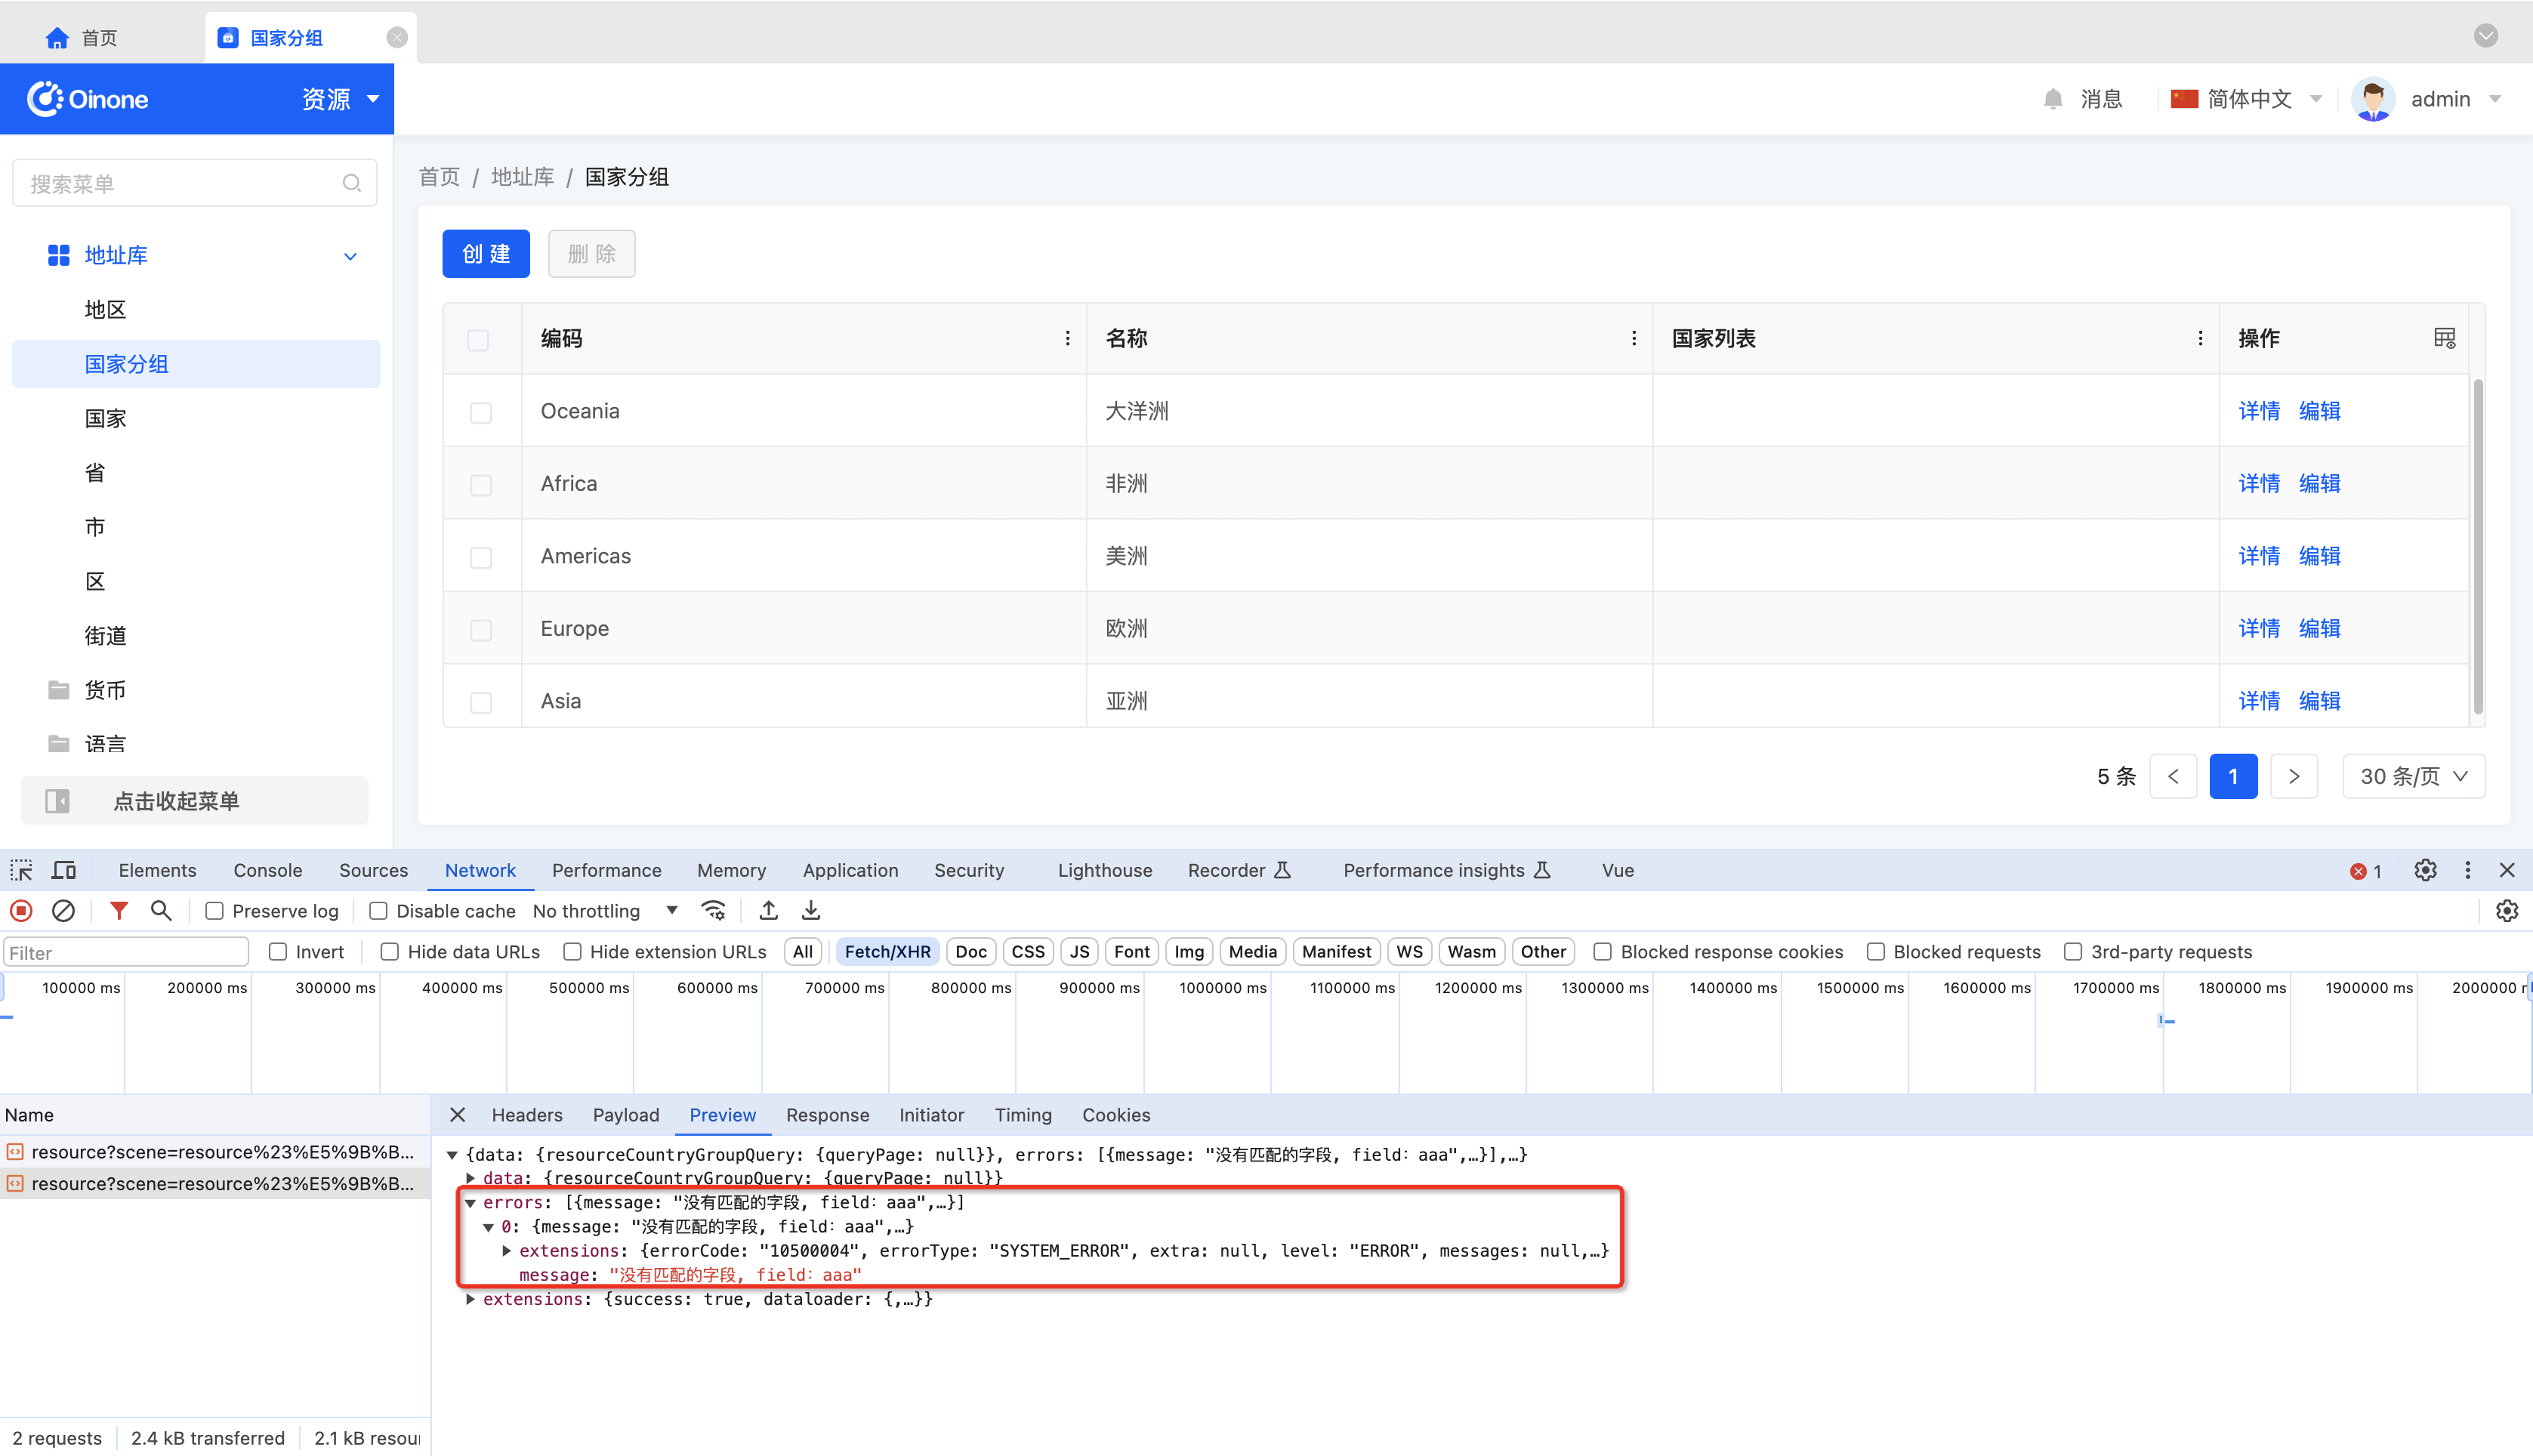
PS: In general, all Oinone requests have an Http status of 200, with error information returned in the errors array.
2. Copying fetch-Style Requests in the Browser Console
3. Pasting into the API Debugging Input Field
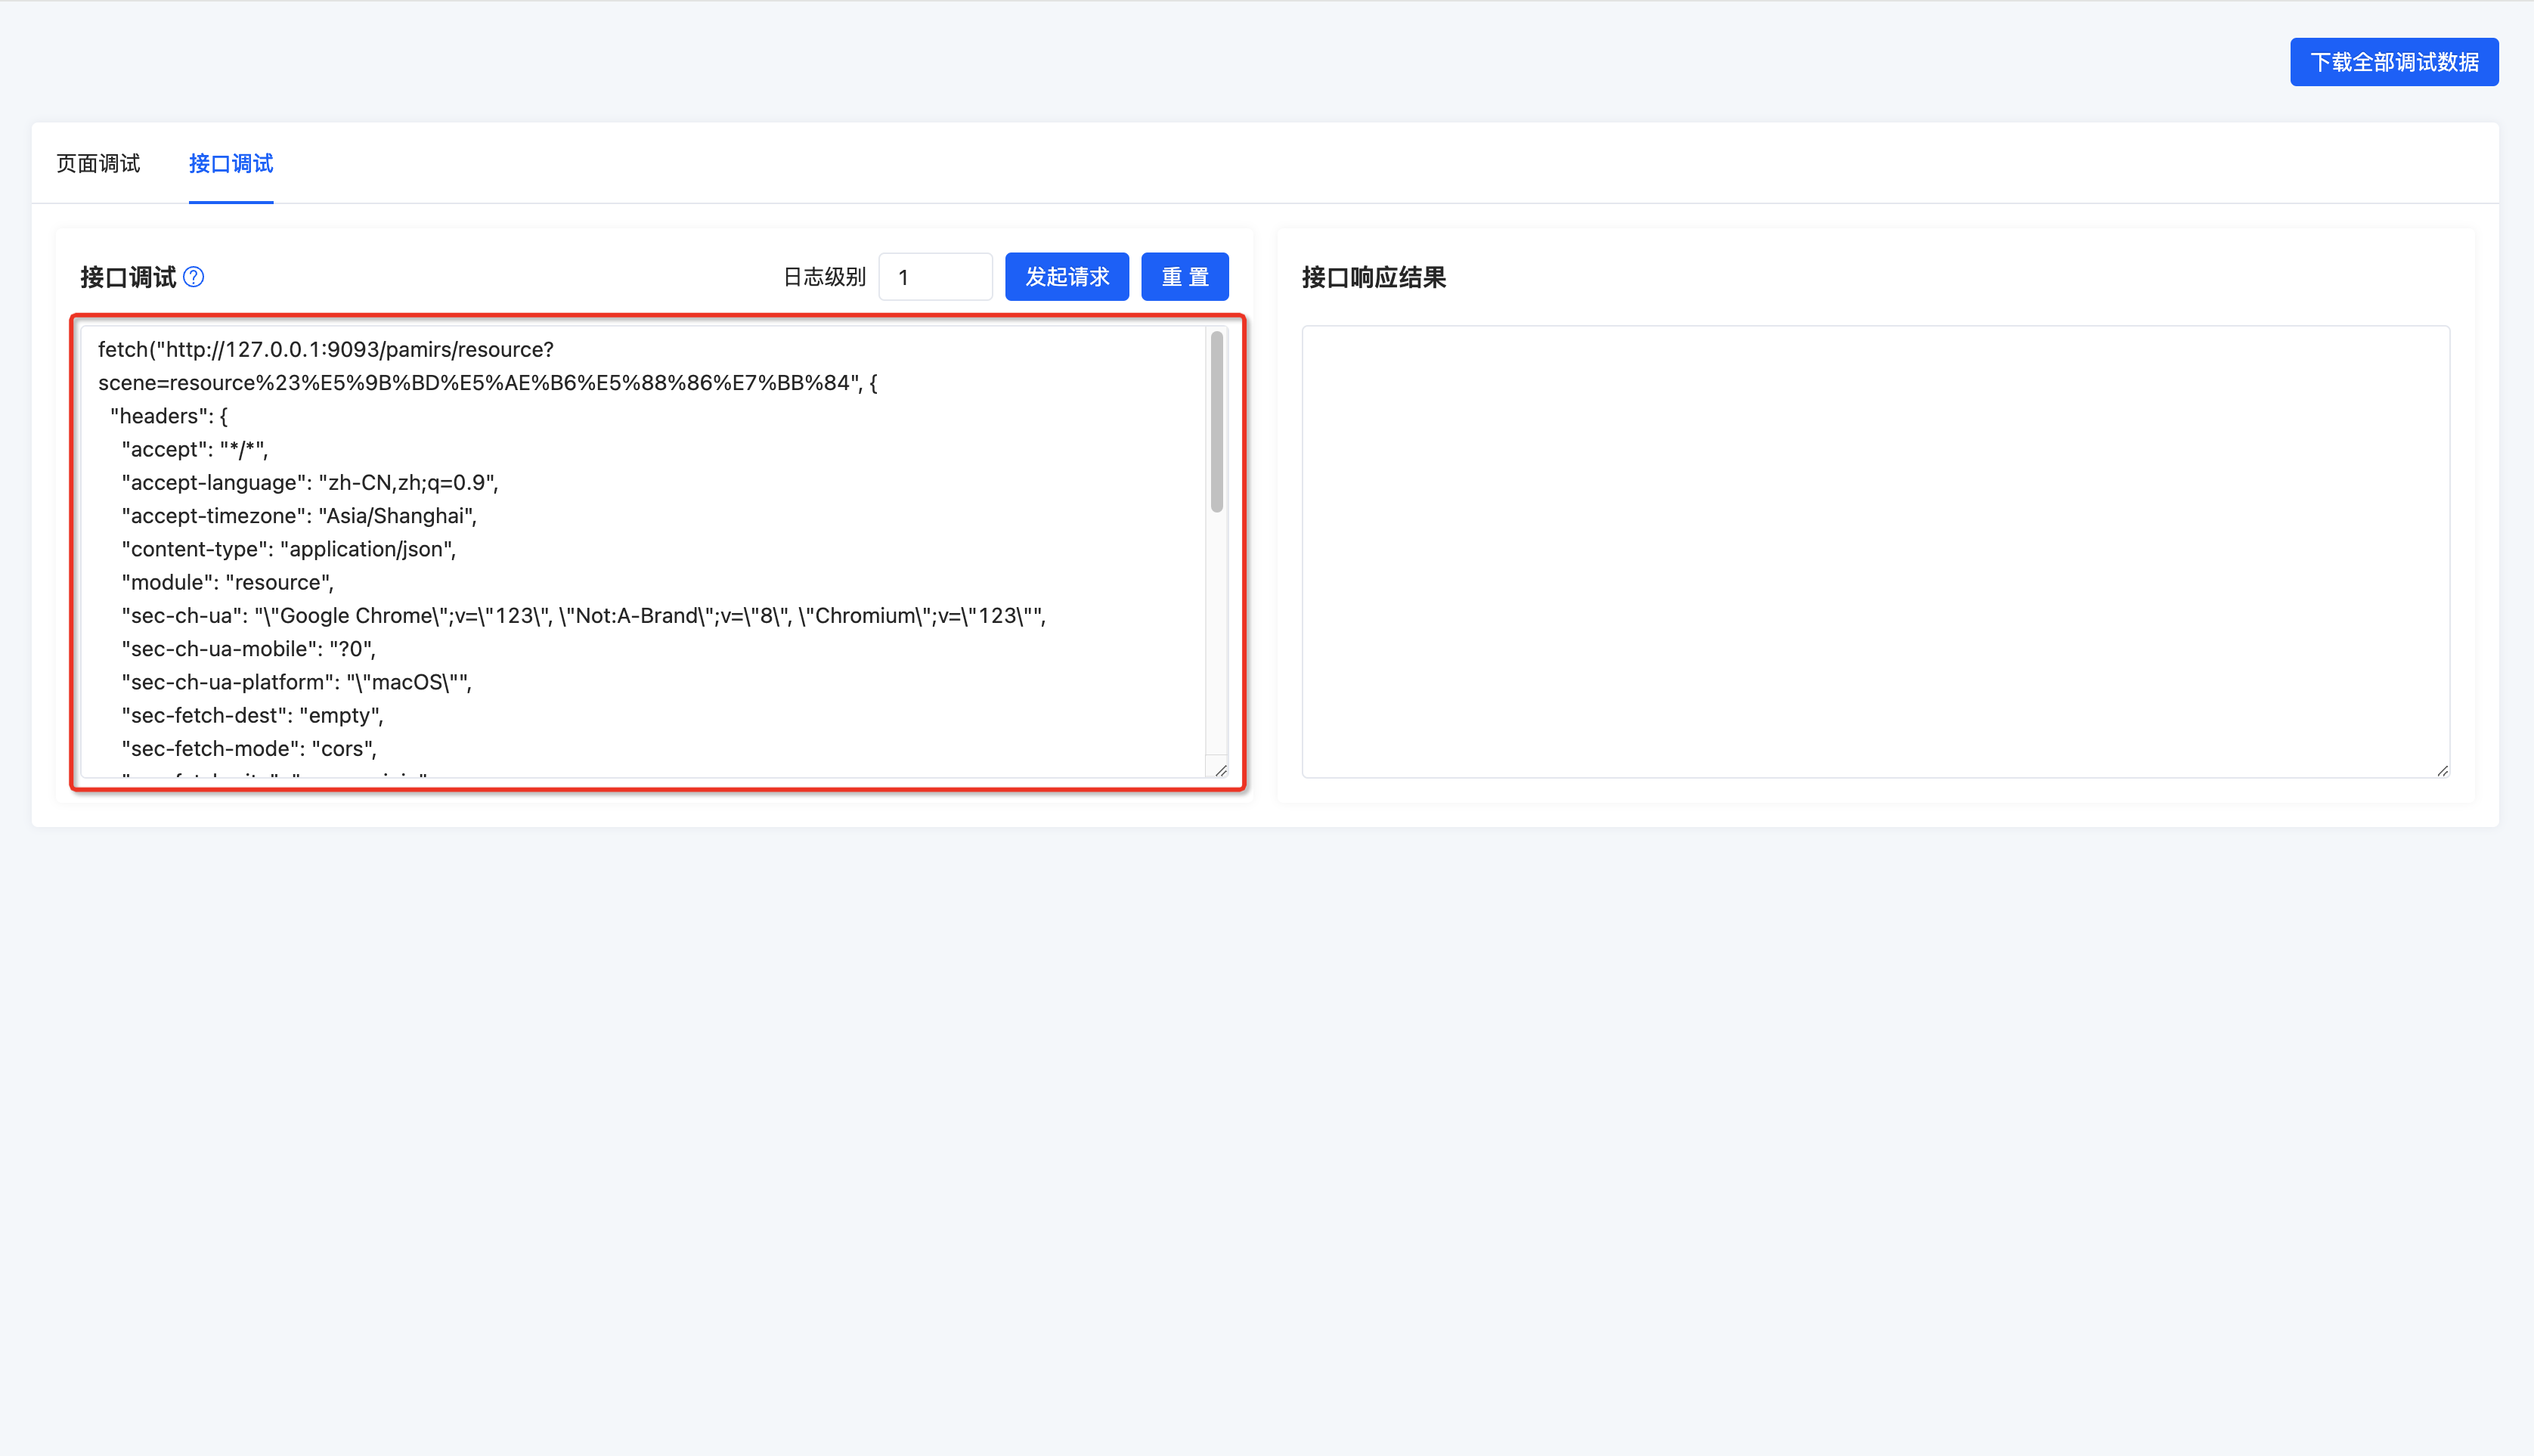
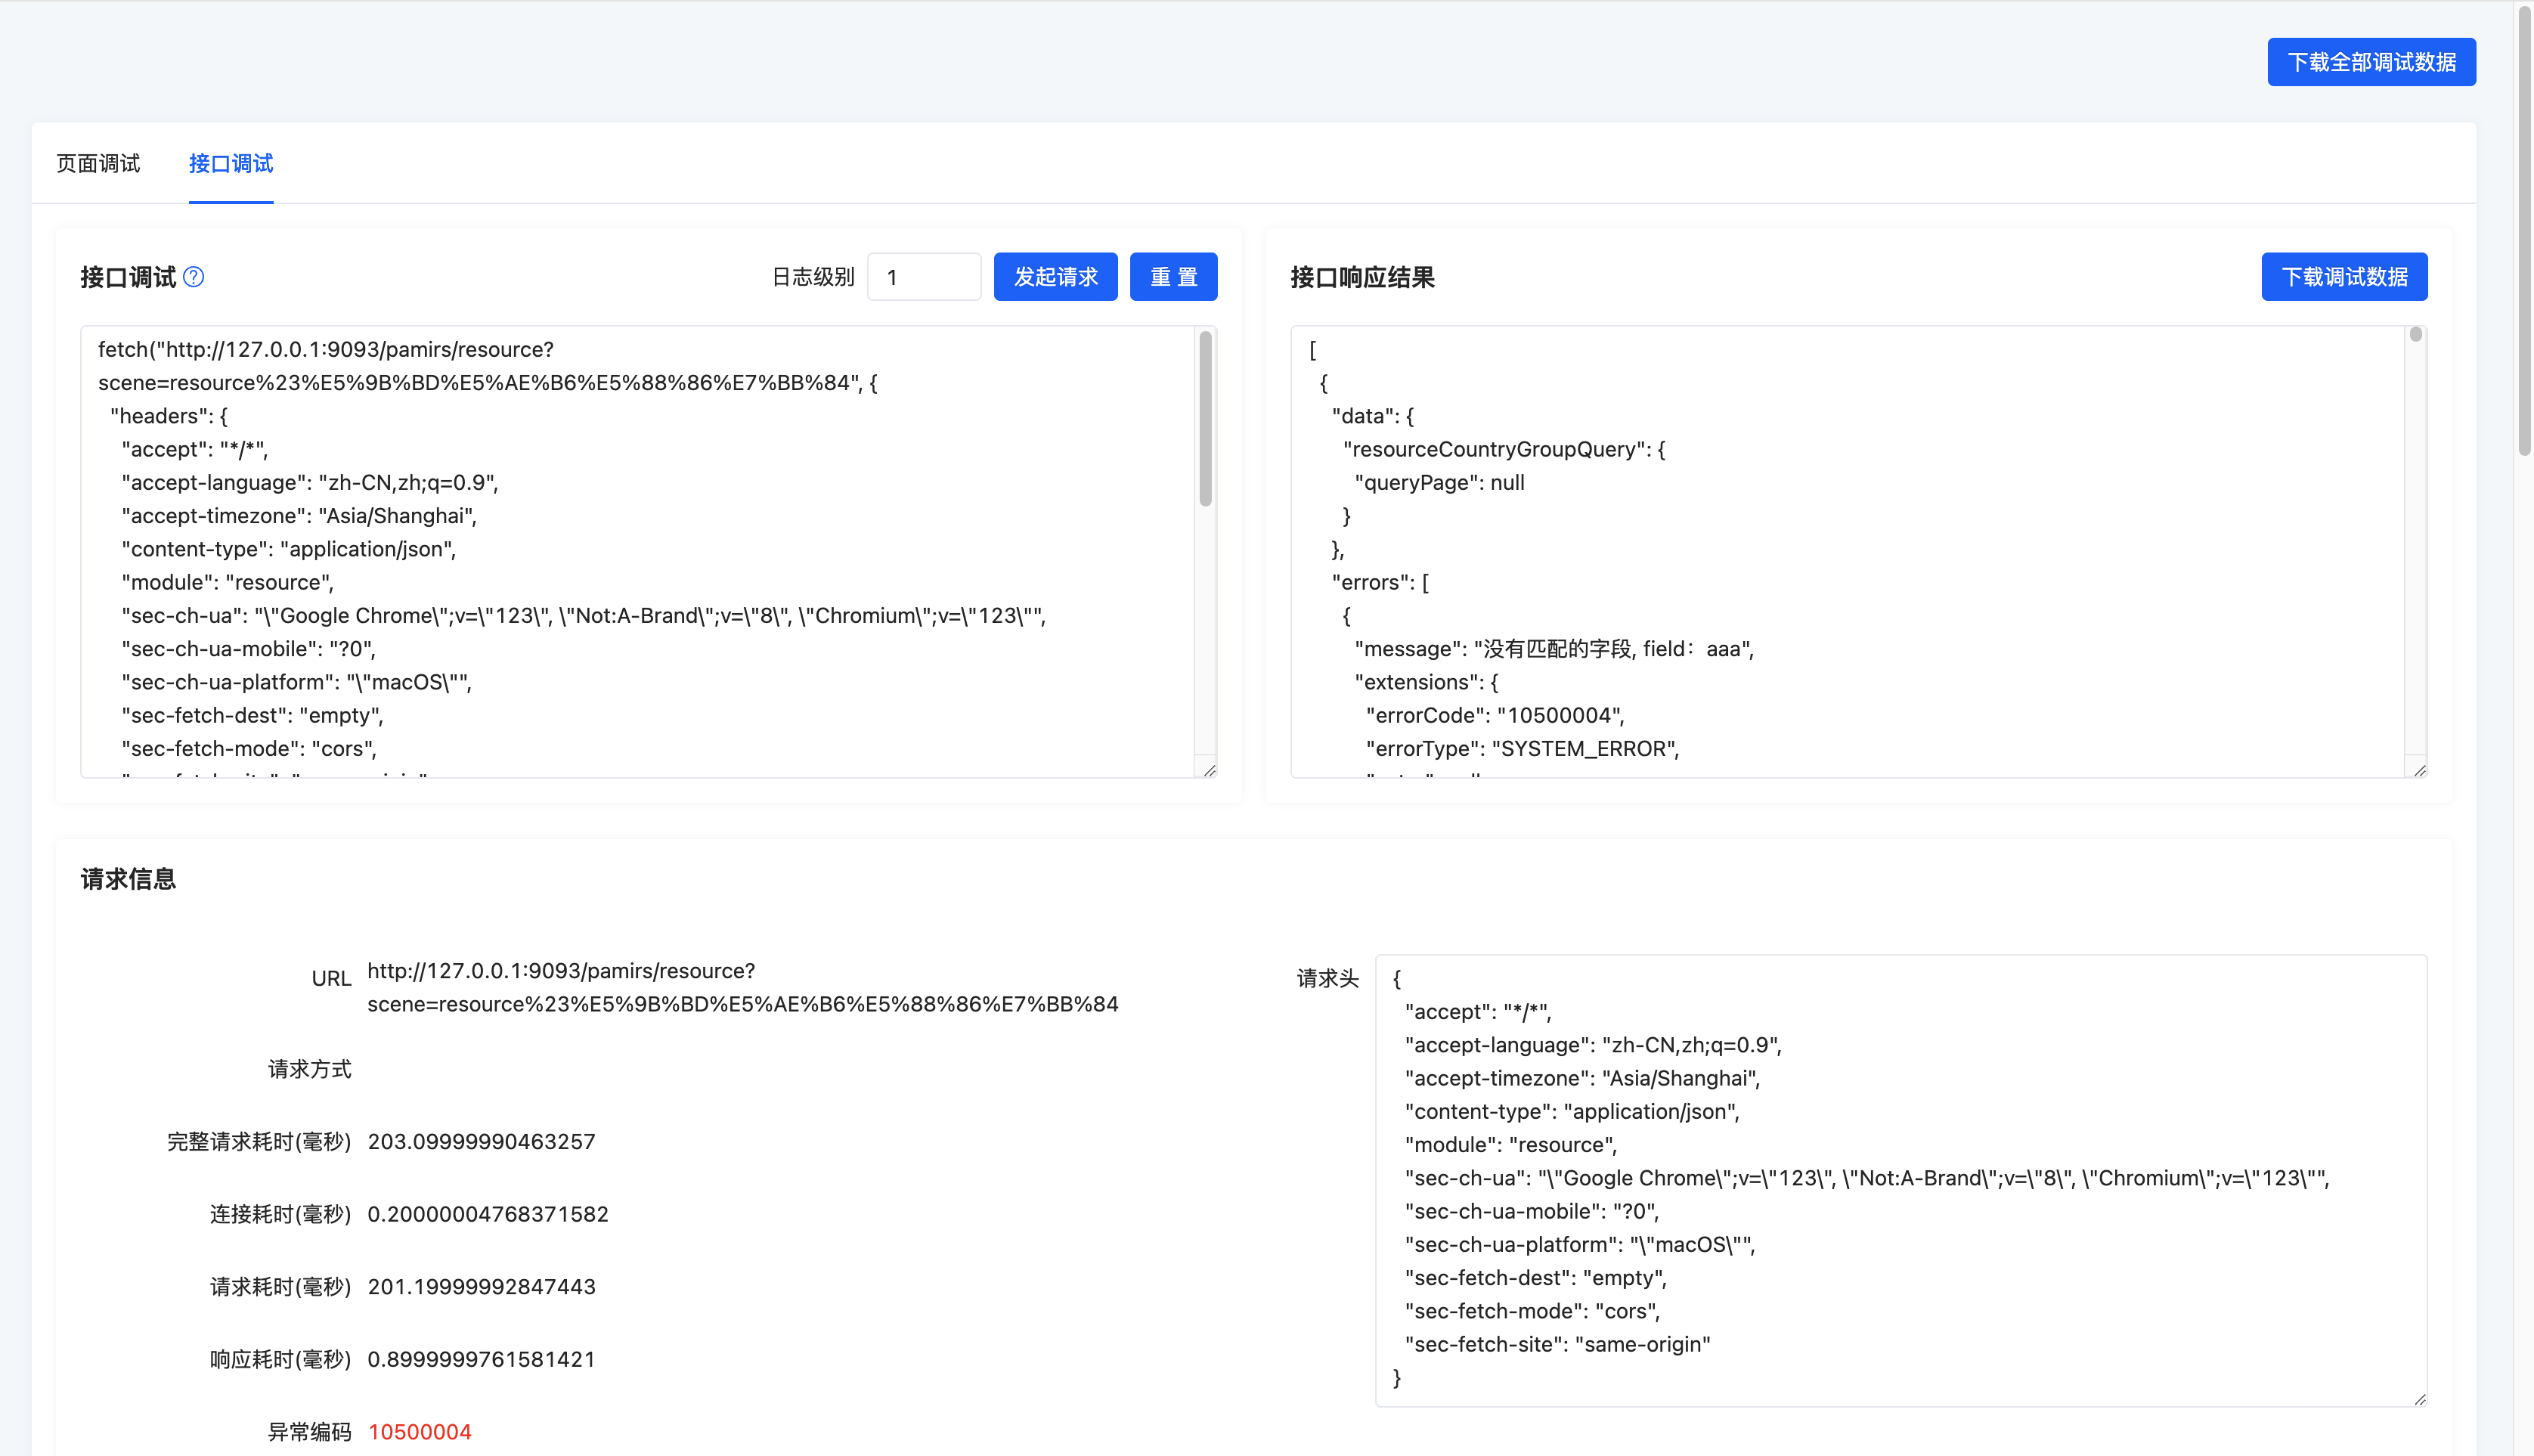
4. Clicking "Initiate Request" to View the API Response Information
Tip:
Log Levels:
- Default Debug: 1
- Permission Debug: 2
- Debug-Level Log Debug: 3
- Trace-Level Log Debug: 4
(Ⅱ) Exception Stack Analysis
Code exceptions are common during development. The debug tools provide simple stack analysis for quickly locating routine issues. You can gradually locate problems using the following functions:
1. Exception Throwing Stack
For some exceptions that can be easily captured, we provide a preliminary analysis function to view the "first scene of the problem," which can precisely locate the class and line of code, as shown in the following figure:

2. Business Stack
If the "first scene of the problem" cannot accurately locate the issue, you can view stack information unrelated to the Spring framework or Oinone framework through the "business stack":
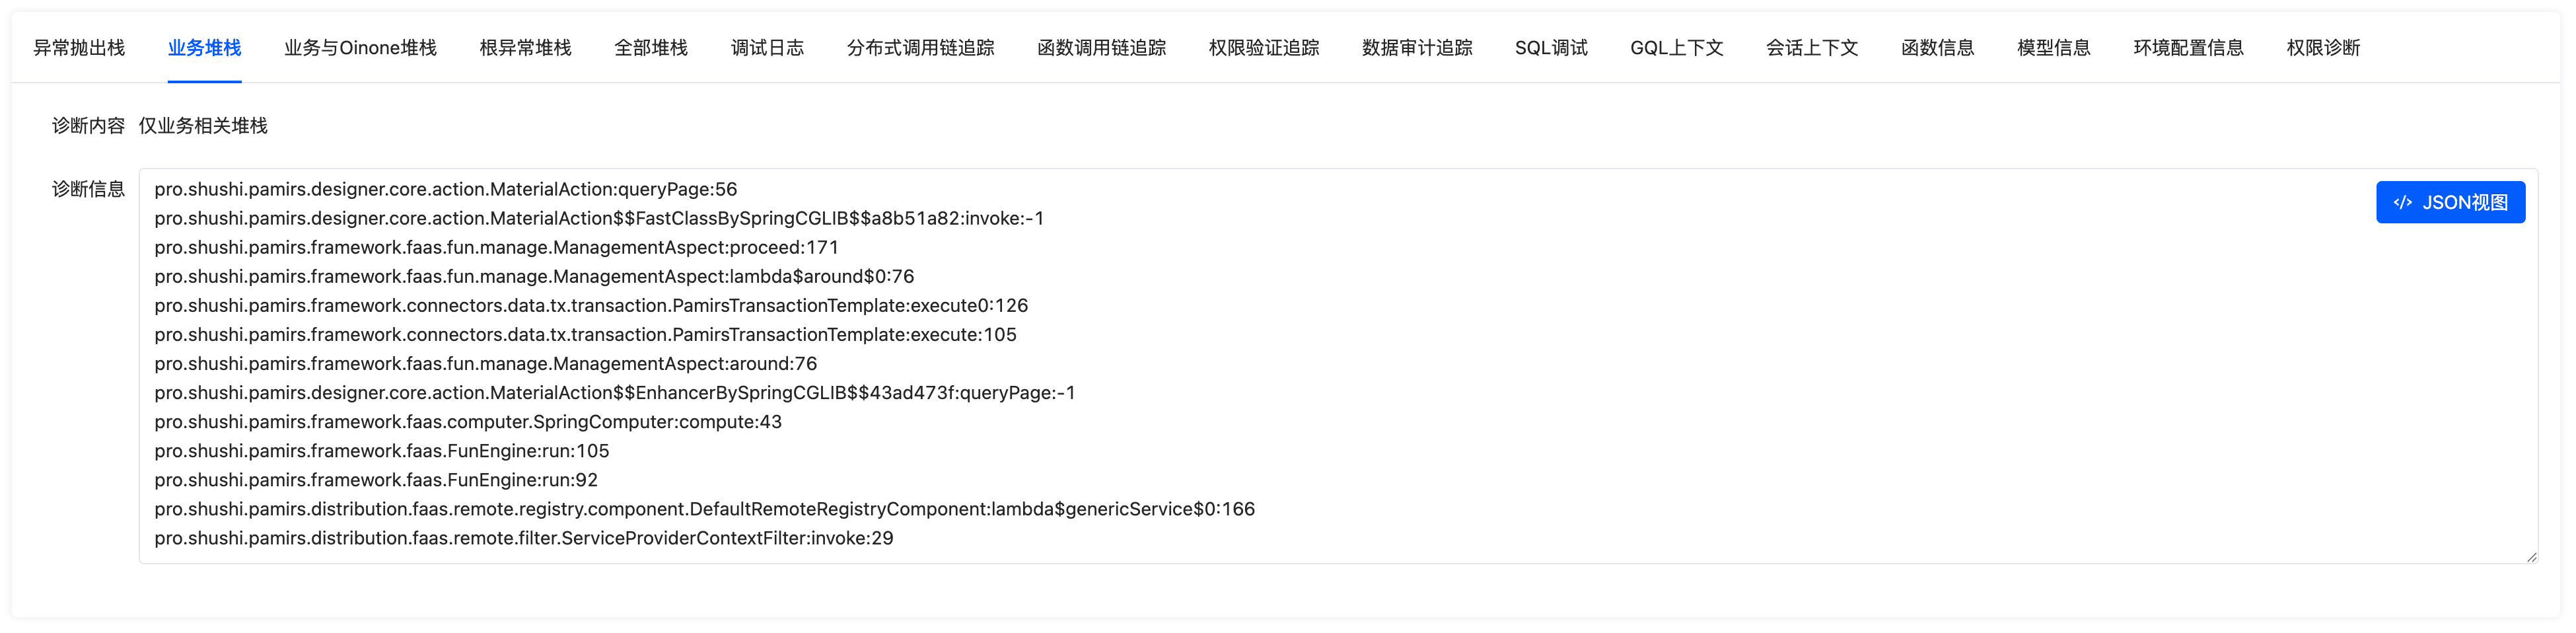
Tip:
This example includes Oinone framework stack information because it is under the shushi package path.
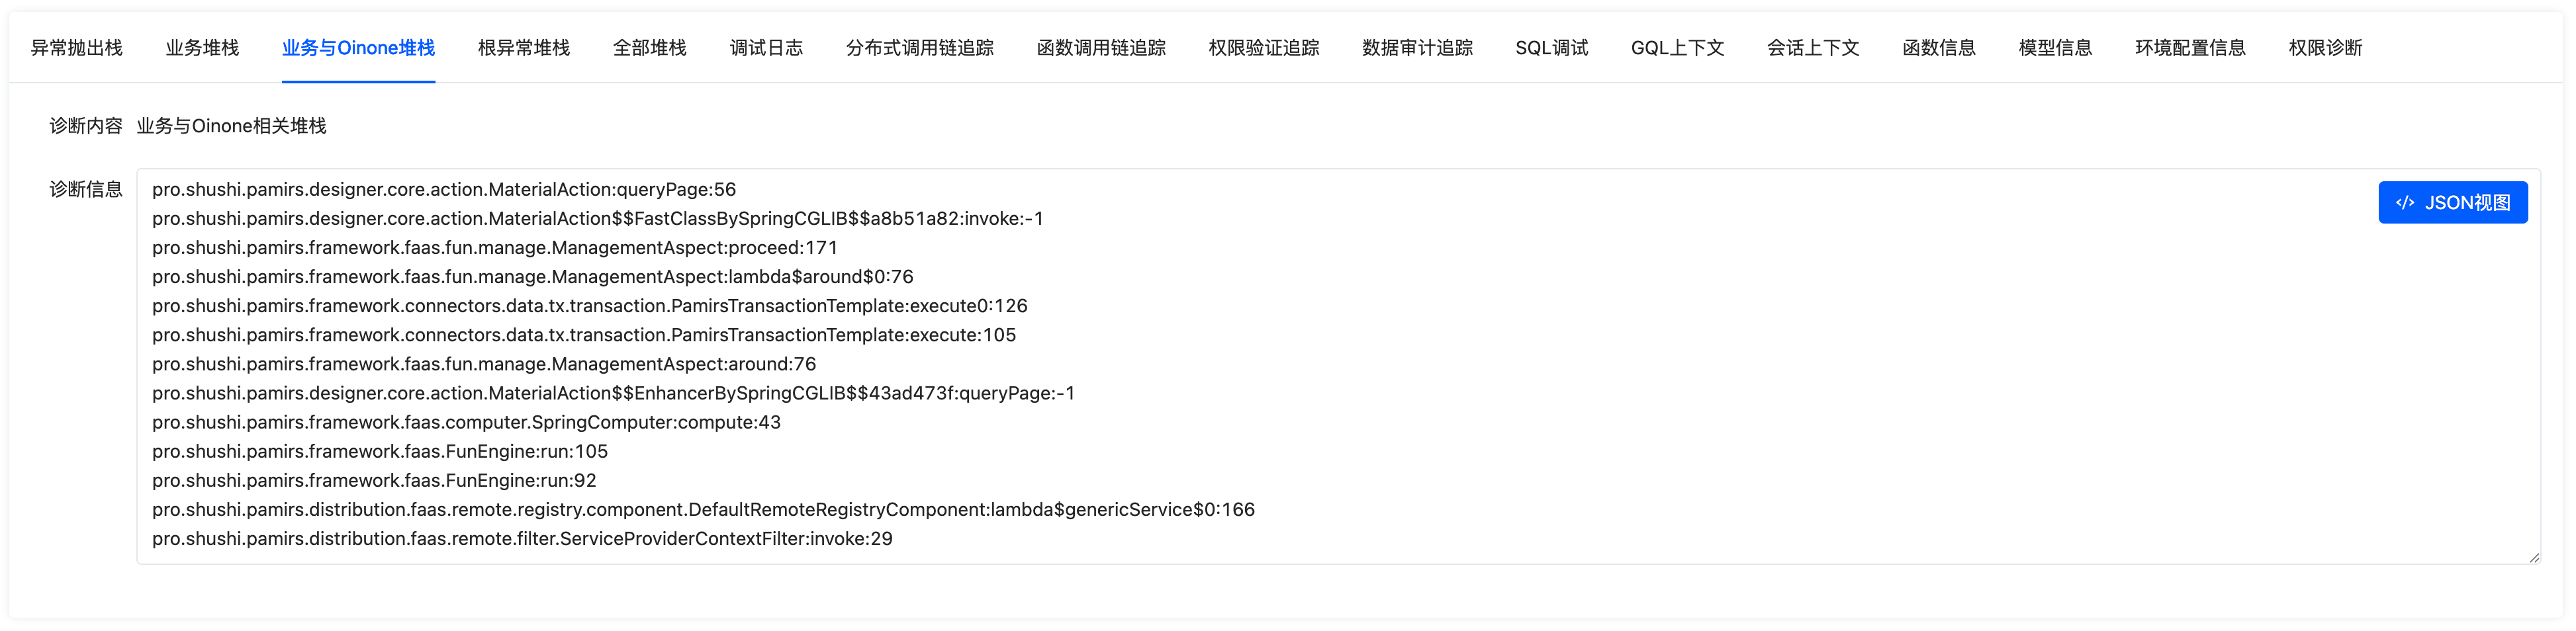
3. Business and Oinone Stack
Stack information increases gradually. If viewing the "business stack" still cannot accurately locate the issue, it may be an exception related to the Oinone framework. You can view stack information including the Oinone framework through the "business and Oinone stack":
4. Root Stack Information and Full Stack
Cropped stacks may fail to locate special issues. In such cases, you need to view complete stack logs through "root stack information" and "full stack," which are typically identical to the logs used when debugging with an IDE.

5. Debug Logs
Sometimes, business-related data is printed for debugging via Logback near exception stacks, but these logs are often disabled in production environments. In debug tools, you can view more fine-grained log information in "debug logs" by adjusting the "log level." When we change the "log level" to 3 and resend the request, we can see debug logs such as Redis connections and data source routing, as shown in the following figure:

(Ⅲ) Request Performance Analysis
For slow request issues, we can use the SQL debugging and function chain tracking functions provided by the debug tools for preliminary analysis. Let's look at how to use this information in performance analysis.
1. SQL Debugging
The following figure shows "SQL debugging" information when executing a queryPage request:
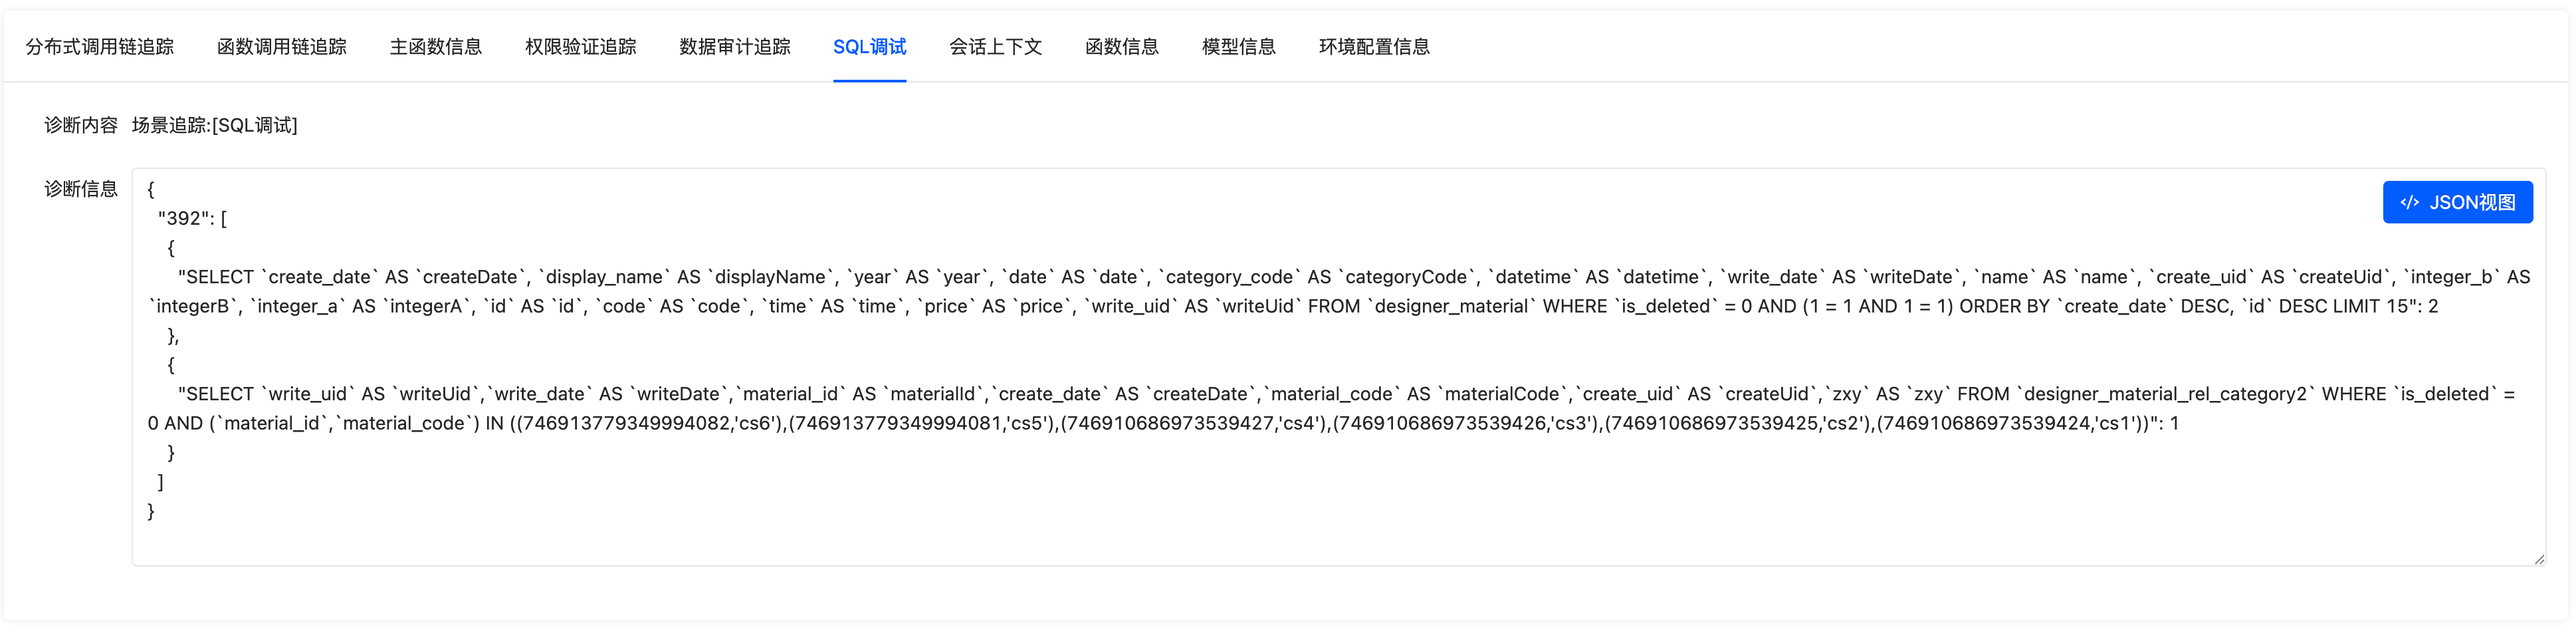
392is thethread IDwhen the current SQL is executed in theJVM. When multiple threads execute concurrently, you will see multipleSQLarrays withthread IDas thekey.- Take the first SQL as an example: The actual executed
SQLserves as thekey, and2indicates the execution time of thisSQLin milliseconds.
For "slow SQL," which generally takes a long time, you can track some "slow SQL" through SQL debugging, then analyze the corresponding SQL via "execution plans" to view details such as execution order and index usage.
2. Function Call Chain Tracking
The following figure shows "function call chain tracking" information when executing a queryPage request:
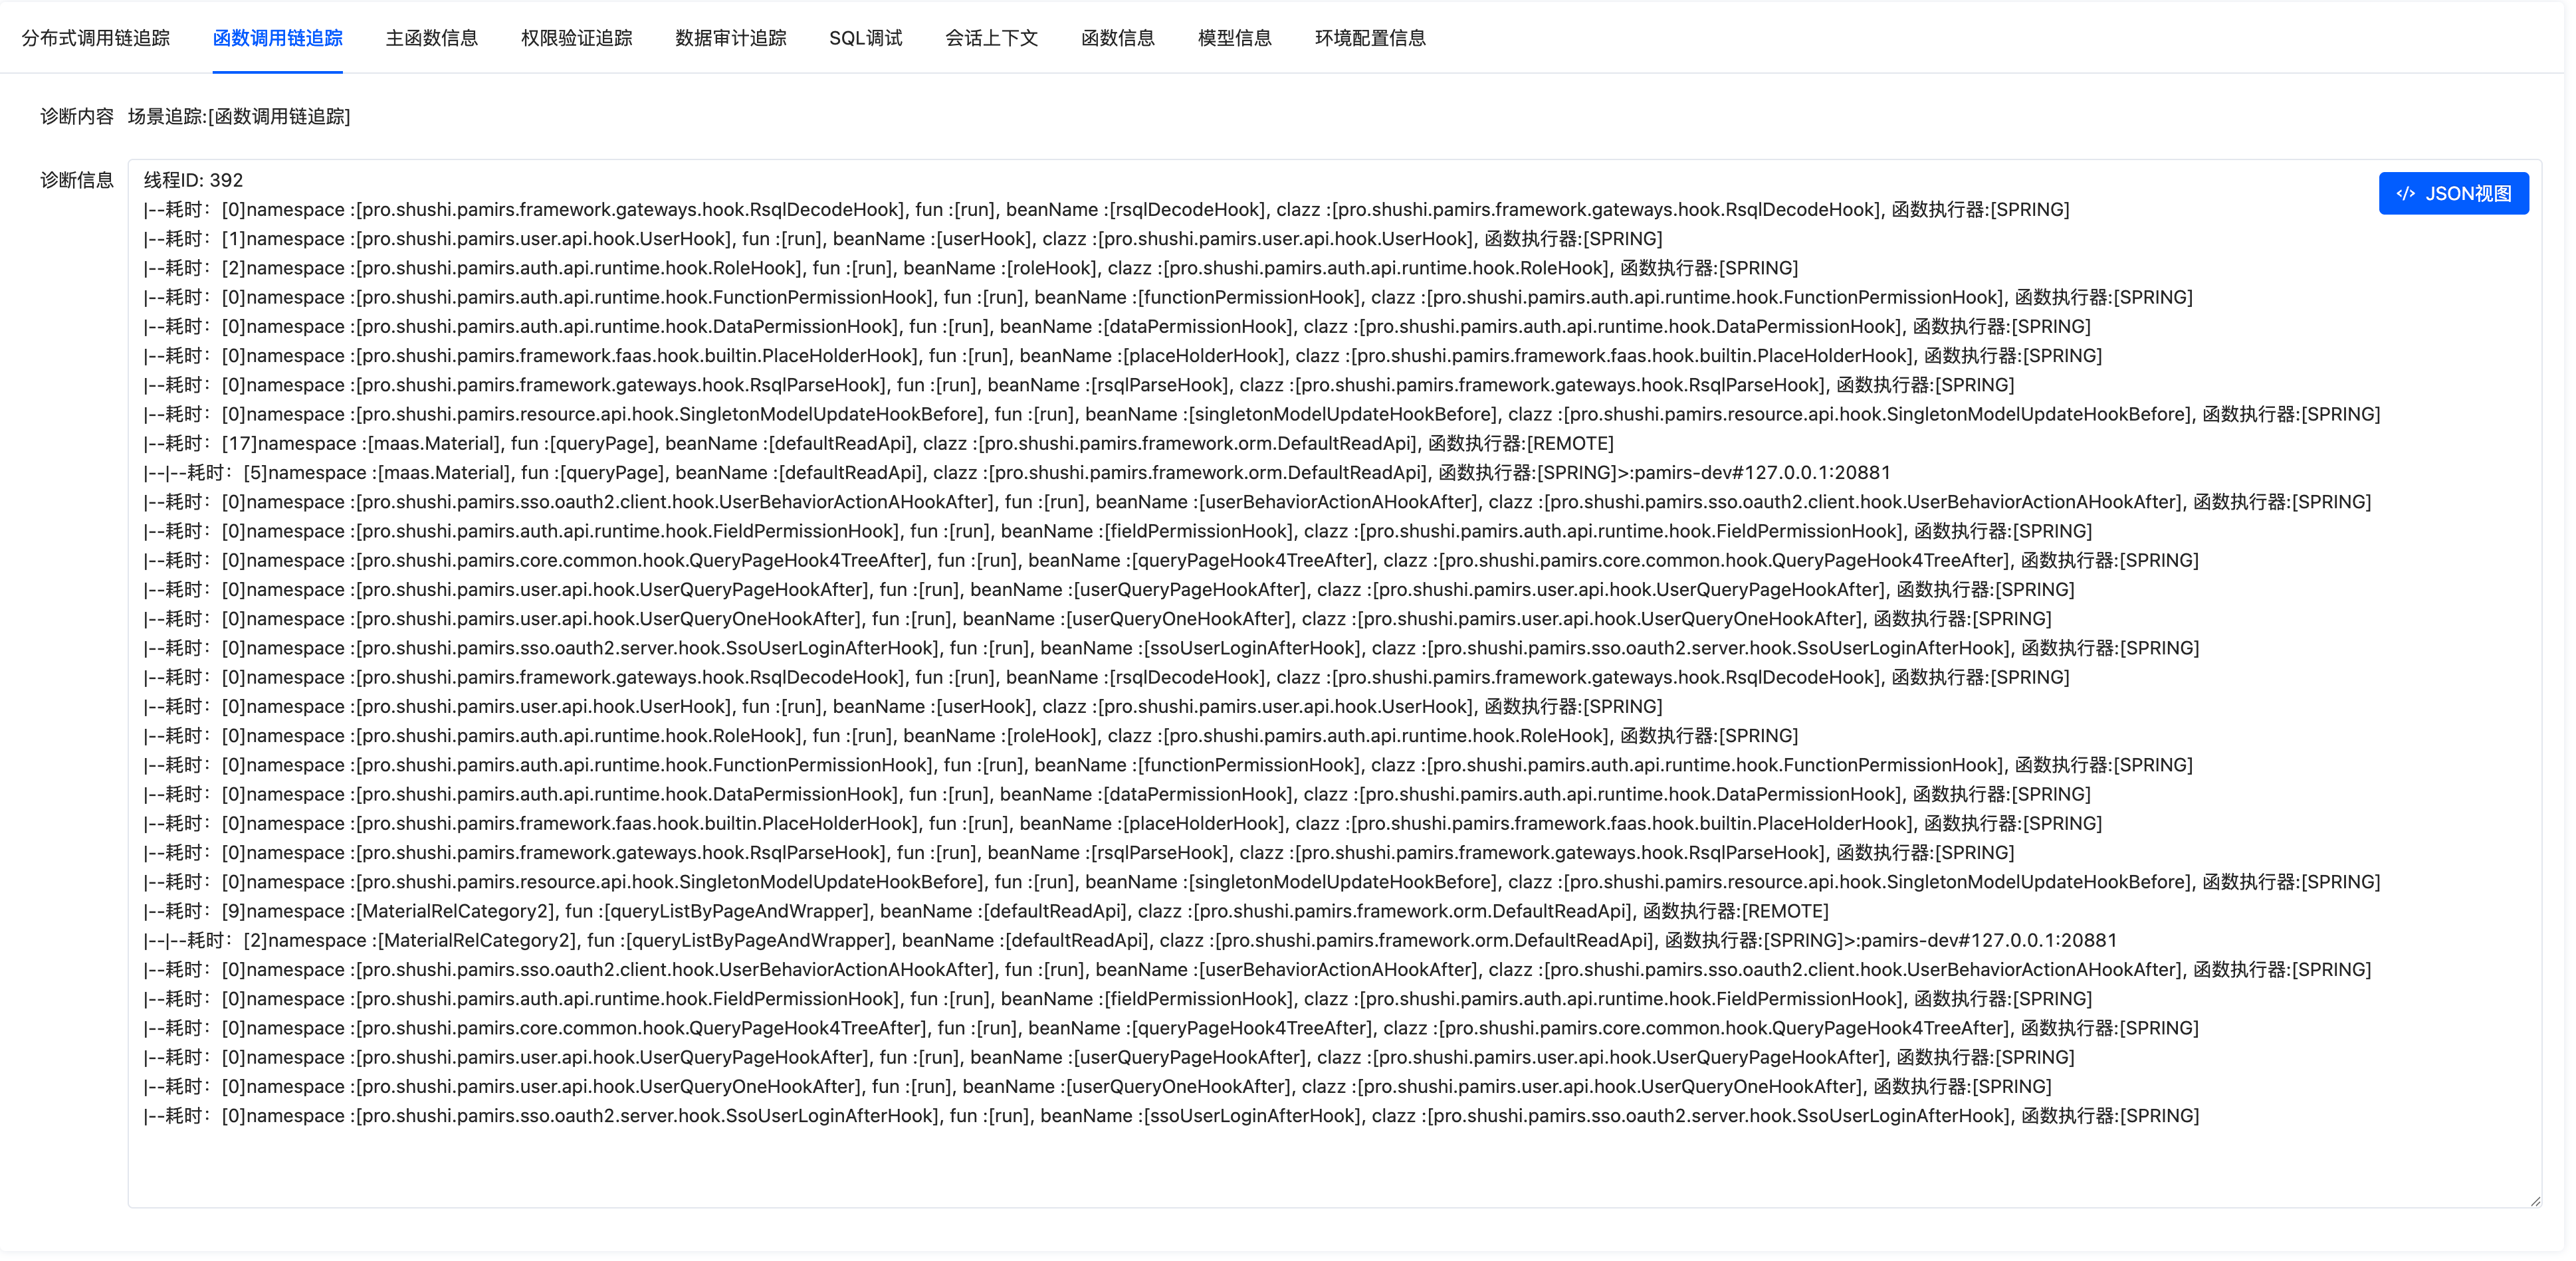
Function tracking format:
|--: Hierarchy symbol. When a function calls another function, the corresponding hierarchy is displayed.Time: [0]: Total time when the current function completes execution.namespace: []: Function namespace.fun: []: Function name.beanName: []: Spring Bean name, which is displayed if the function is executed in a Spring Bean.clazz: []: Full path class name.Function executor: []: Oinone FunEngine provides multiple executors, and different functions are executed by different types of executors.SPRING: Spring function executor.REMOTE: Remote call executor.LOCAL: Non-Spring function executor.
>:pamirs-dev#127.0.0.1:20881: Indicates that the current function is executed on the service with theapplication name (spring.application.name), and the correspondingdubboregistration IP and port are127.0.0.1:20881.
(Ⅳ) Permission Verification Failure Analysis
When an interface throws an exception such as "no permission to perform this operation" as shown in the following figure:
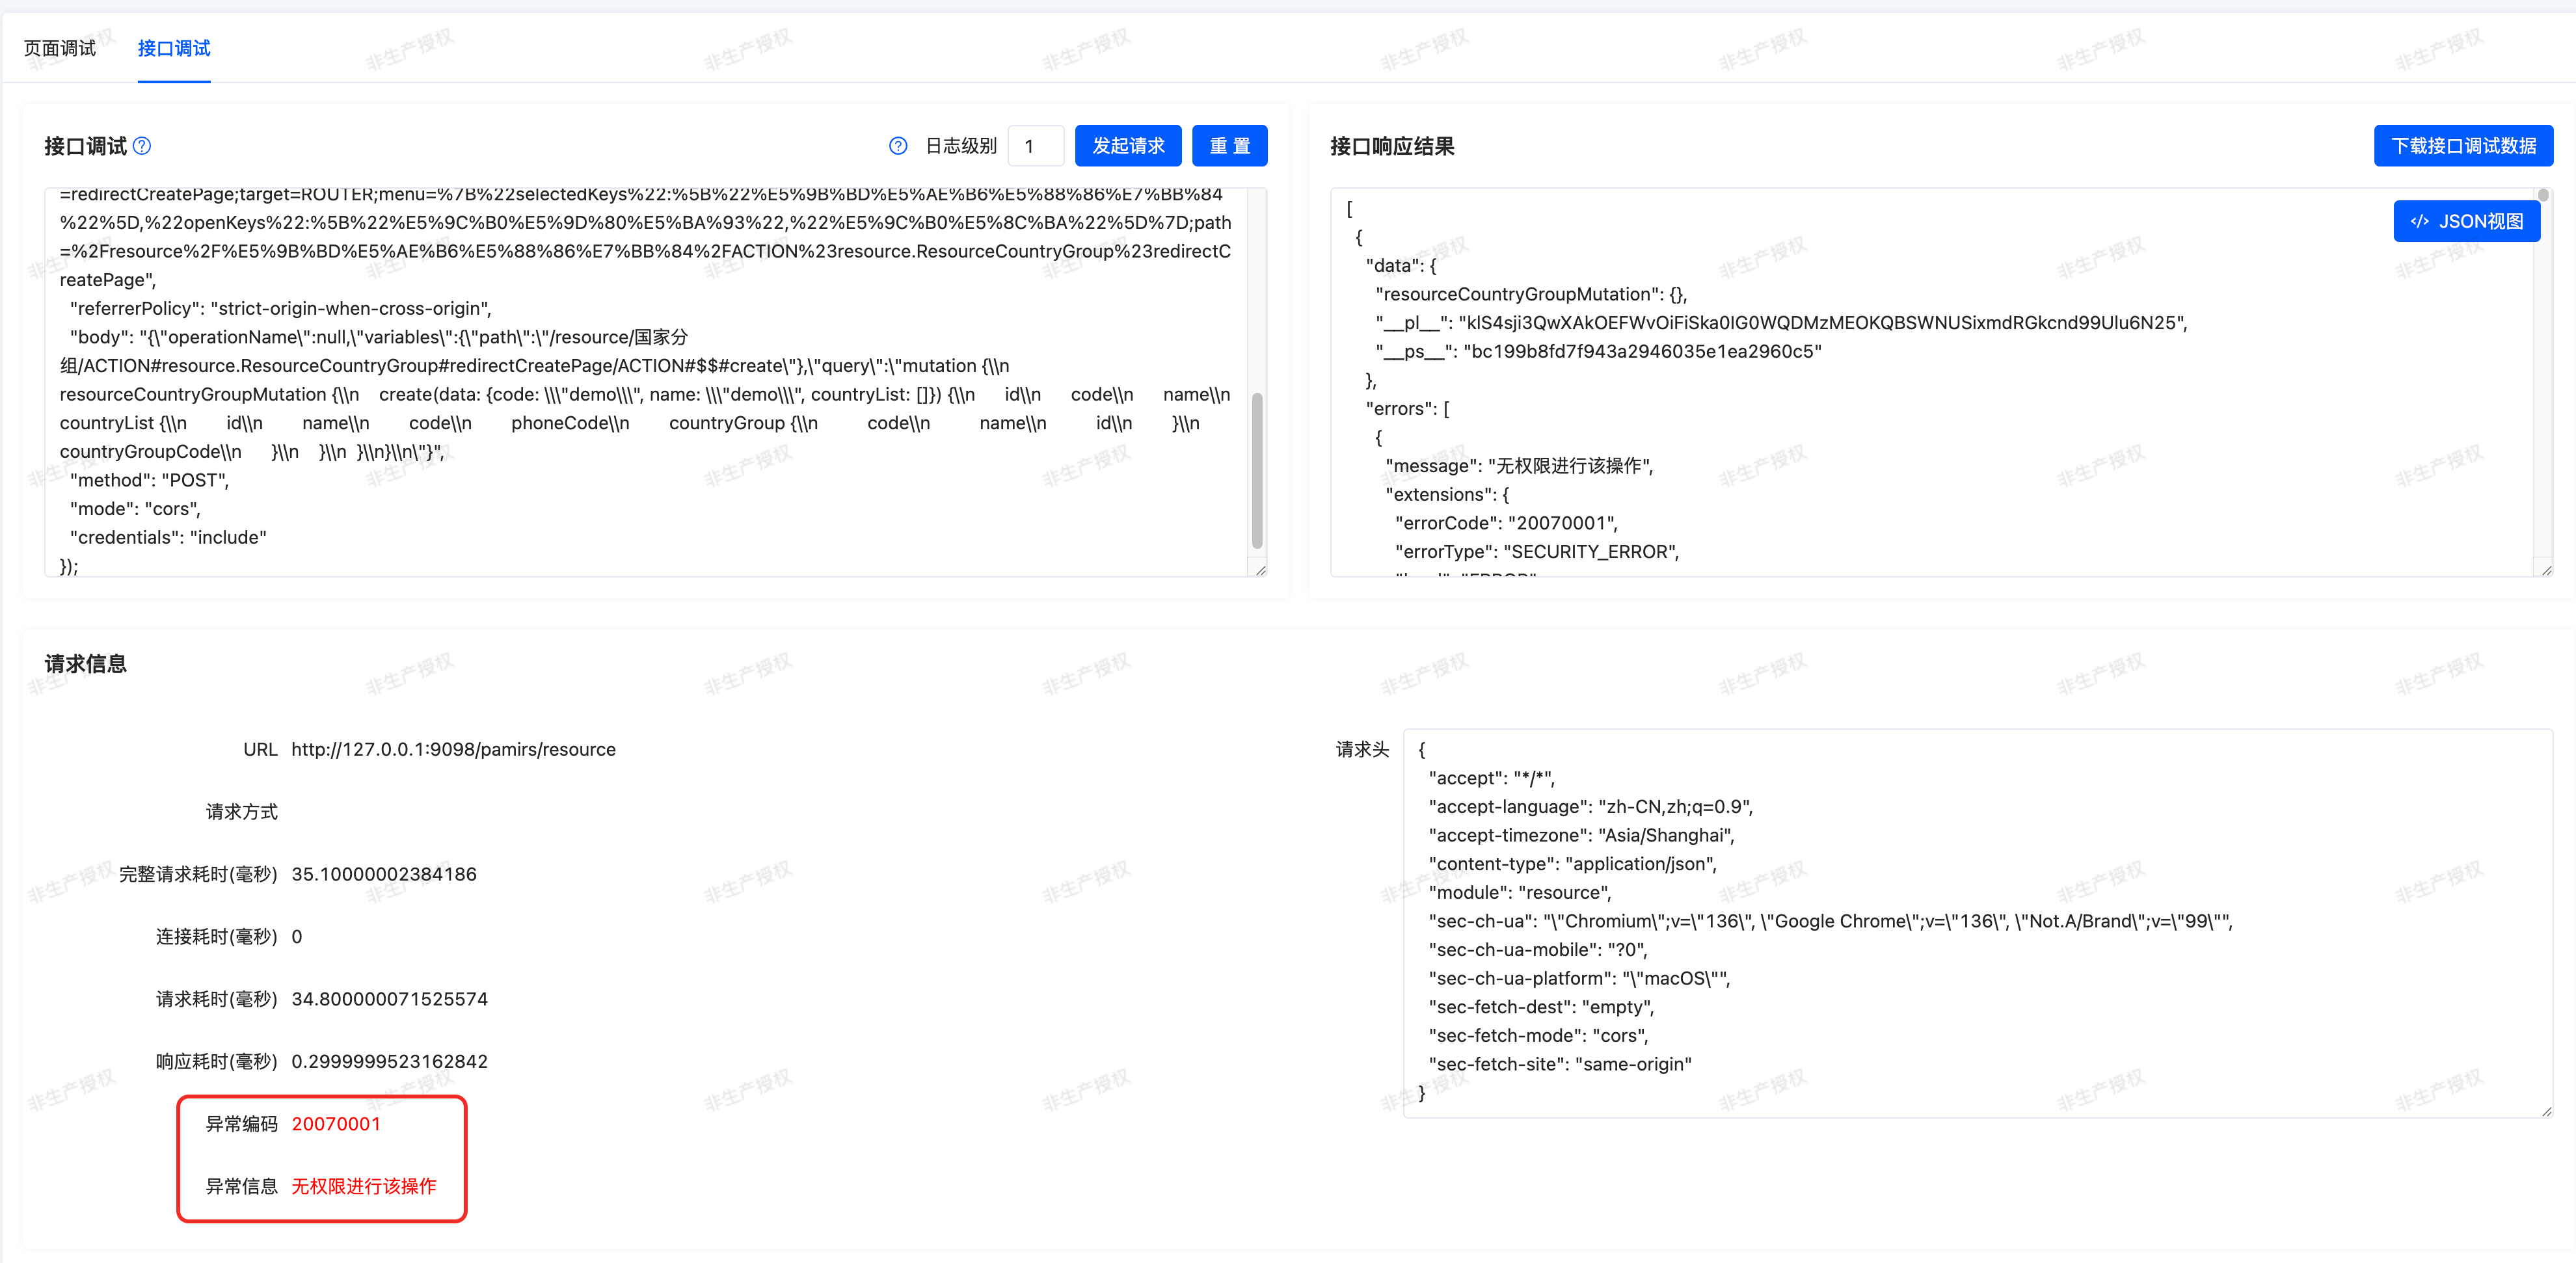
You can perform preliminary analysis by viewing the information provided in the "permission verification tracking" panel:
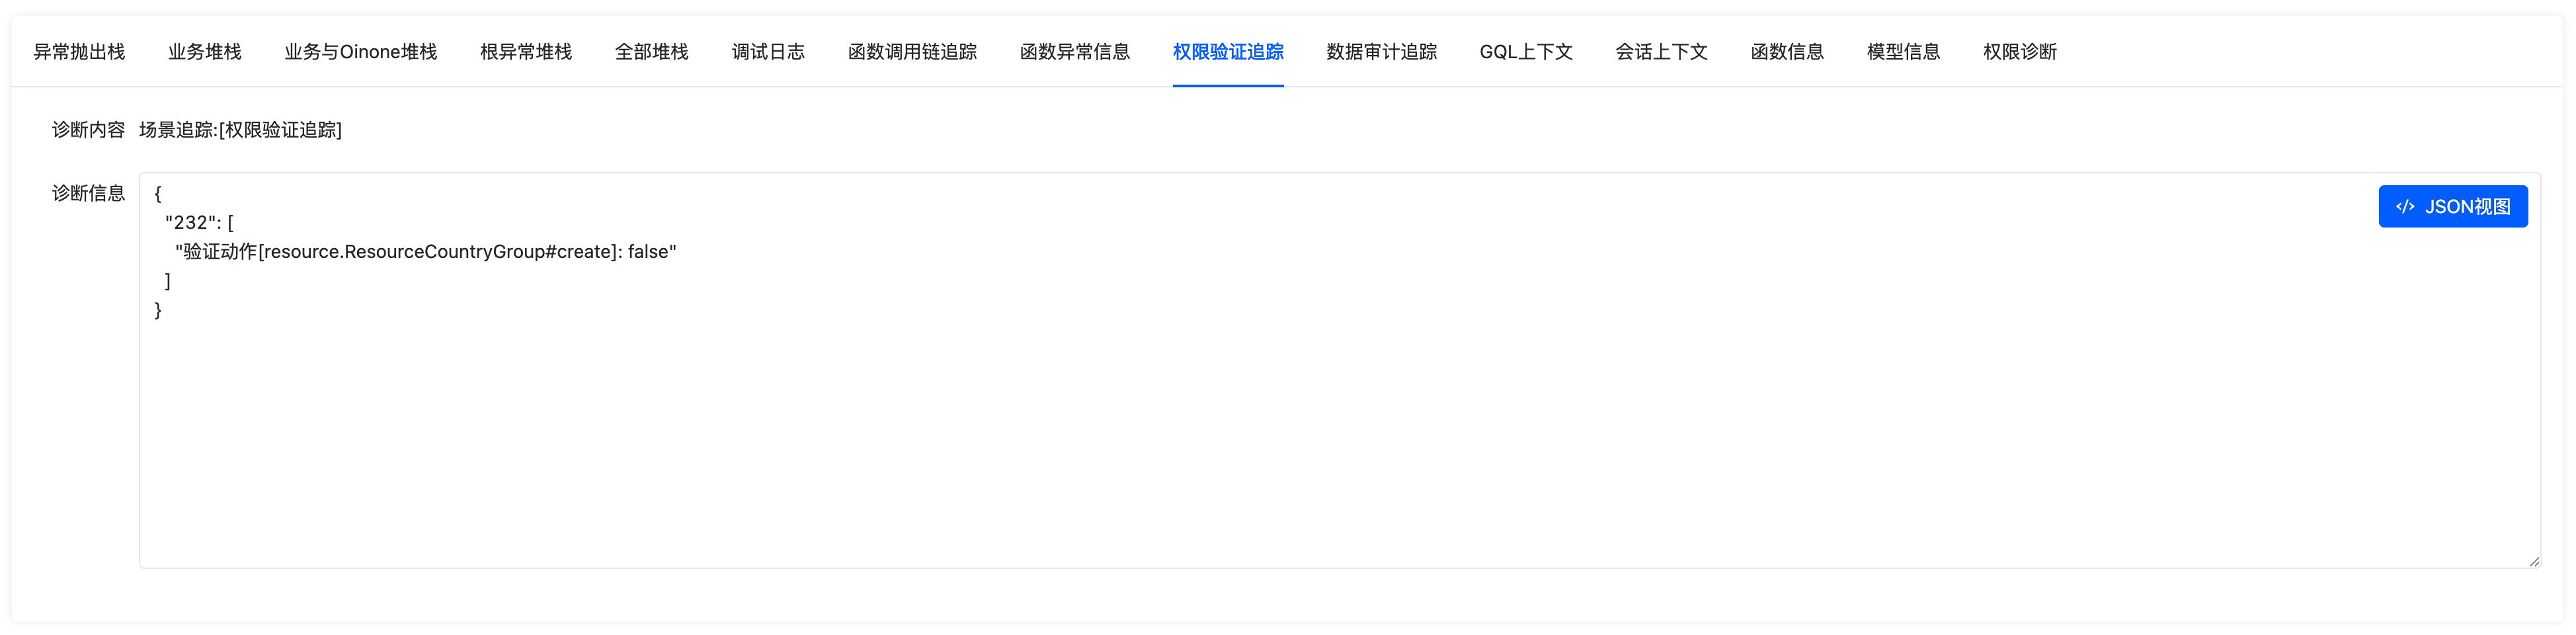
Some possible verification information in the "permission verification tracking" panel:
- Module verification: Verify whether the current user can access the specified module.
- Home verification: Verify whether the current user can access the specified module's home page.
- Menu verification: Verify whether the current user can access the specified menu.
- Action verification: Verify whether the current user can access the specified action. As shown in the figure, false indicates no permission to execute.
- Action path verification: Verify specified action permissions through the current session path (SessionPath).
- Function verification: Verify whether the current user can access the specified function.
- Model read permission: Read permission expression for the specified model; null indicates no configuration.
- Model visible fields: Readable fields for the specified model; fields not in the list are unreadable.
- Model editable fields: Editable fields for the specified model; fields not in the list are uneditable.
Tip:
Different requests use different permission restrictions, so these verification information items do not always all appear. The absence of a specified item generally means that the item was not verified or the permission was not restricted.
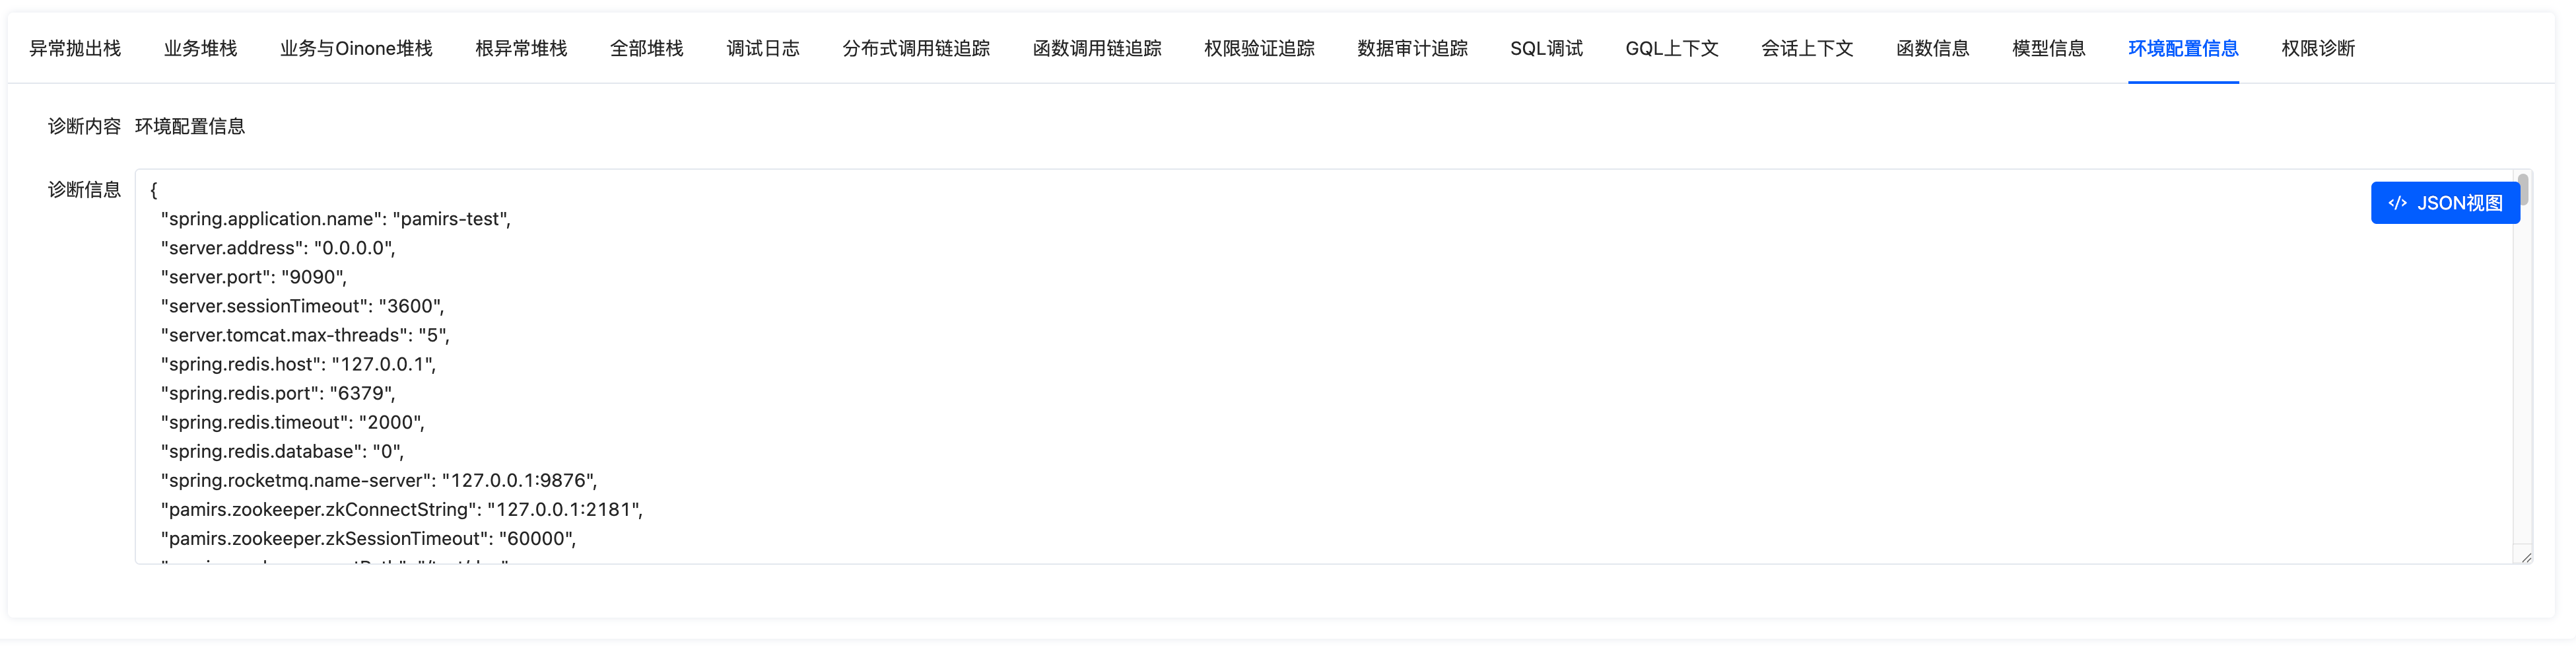
(Ⅴ) Environment Configuration Information
When environment configuration issues occur, you can obtain server configurations through debug tools without accessing the server. This configuration information can only be obtained by logging in as an "administrator"; other users are prohibited from accessing it.
V. Disabling Debug Tools in Production Environment
(Ⅰ) Disabling Debug Tools on the Front End
In the front-end runtime environment configuration, you can disable the debug page route through debug configuration. Refer to: Front-End API - Environment
runtimeConfigResolve({
  debug: {
    enabled: true
  }
});(Ⅱ) Disabling Debug APIs on the Back End
Configuring pamirs.framework.debug.enabled as false in Yaml disables debug APIs. Refer to: Back-End API - Module API
pamirs:
  framework:
    debug:
      enabled: false