Ⅰ. Dependent Packages
Add the dependent packages for data visualization operations in the pom of the business project.
Refer to the document How to Add Data Visualization Runtime Dependencies
Ⅱ. Designing Charts, Reports, and Data Dashboards for Data Visualization
Design charts suitable for the business in data visualization, and after publishing, the charts can be embedded in the interface designer. 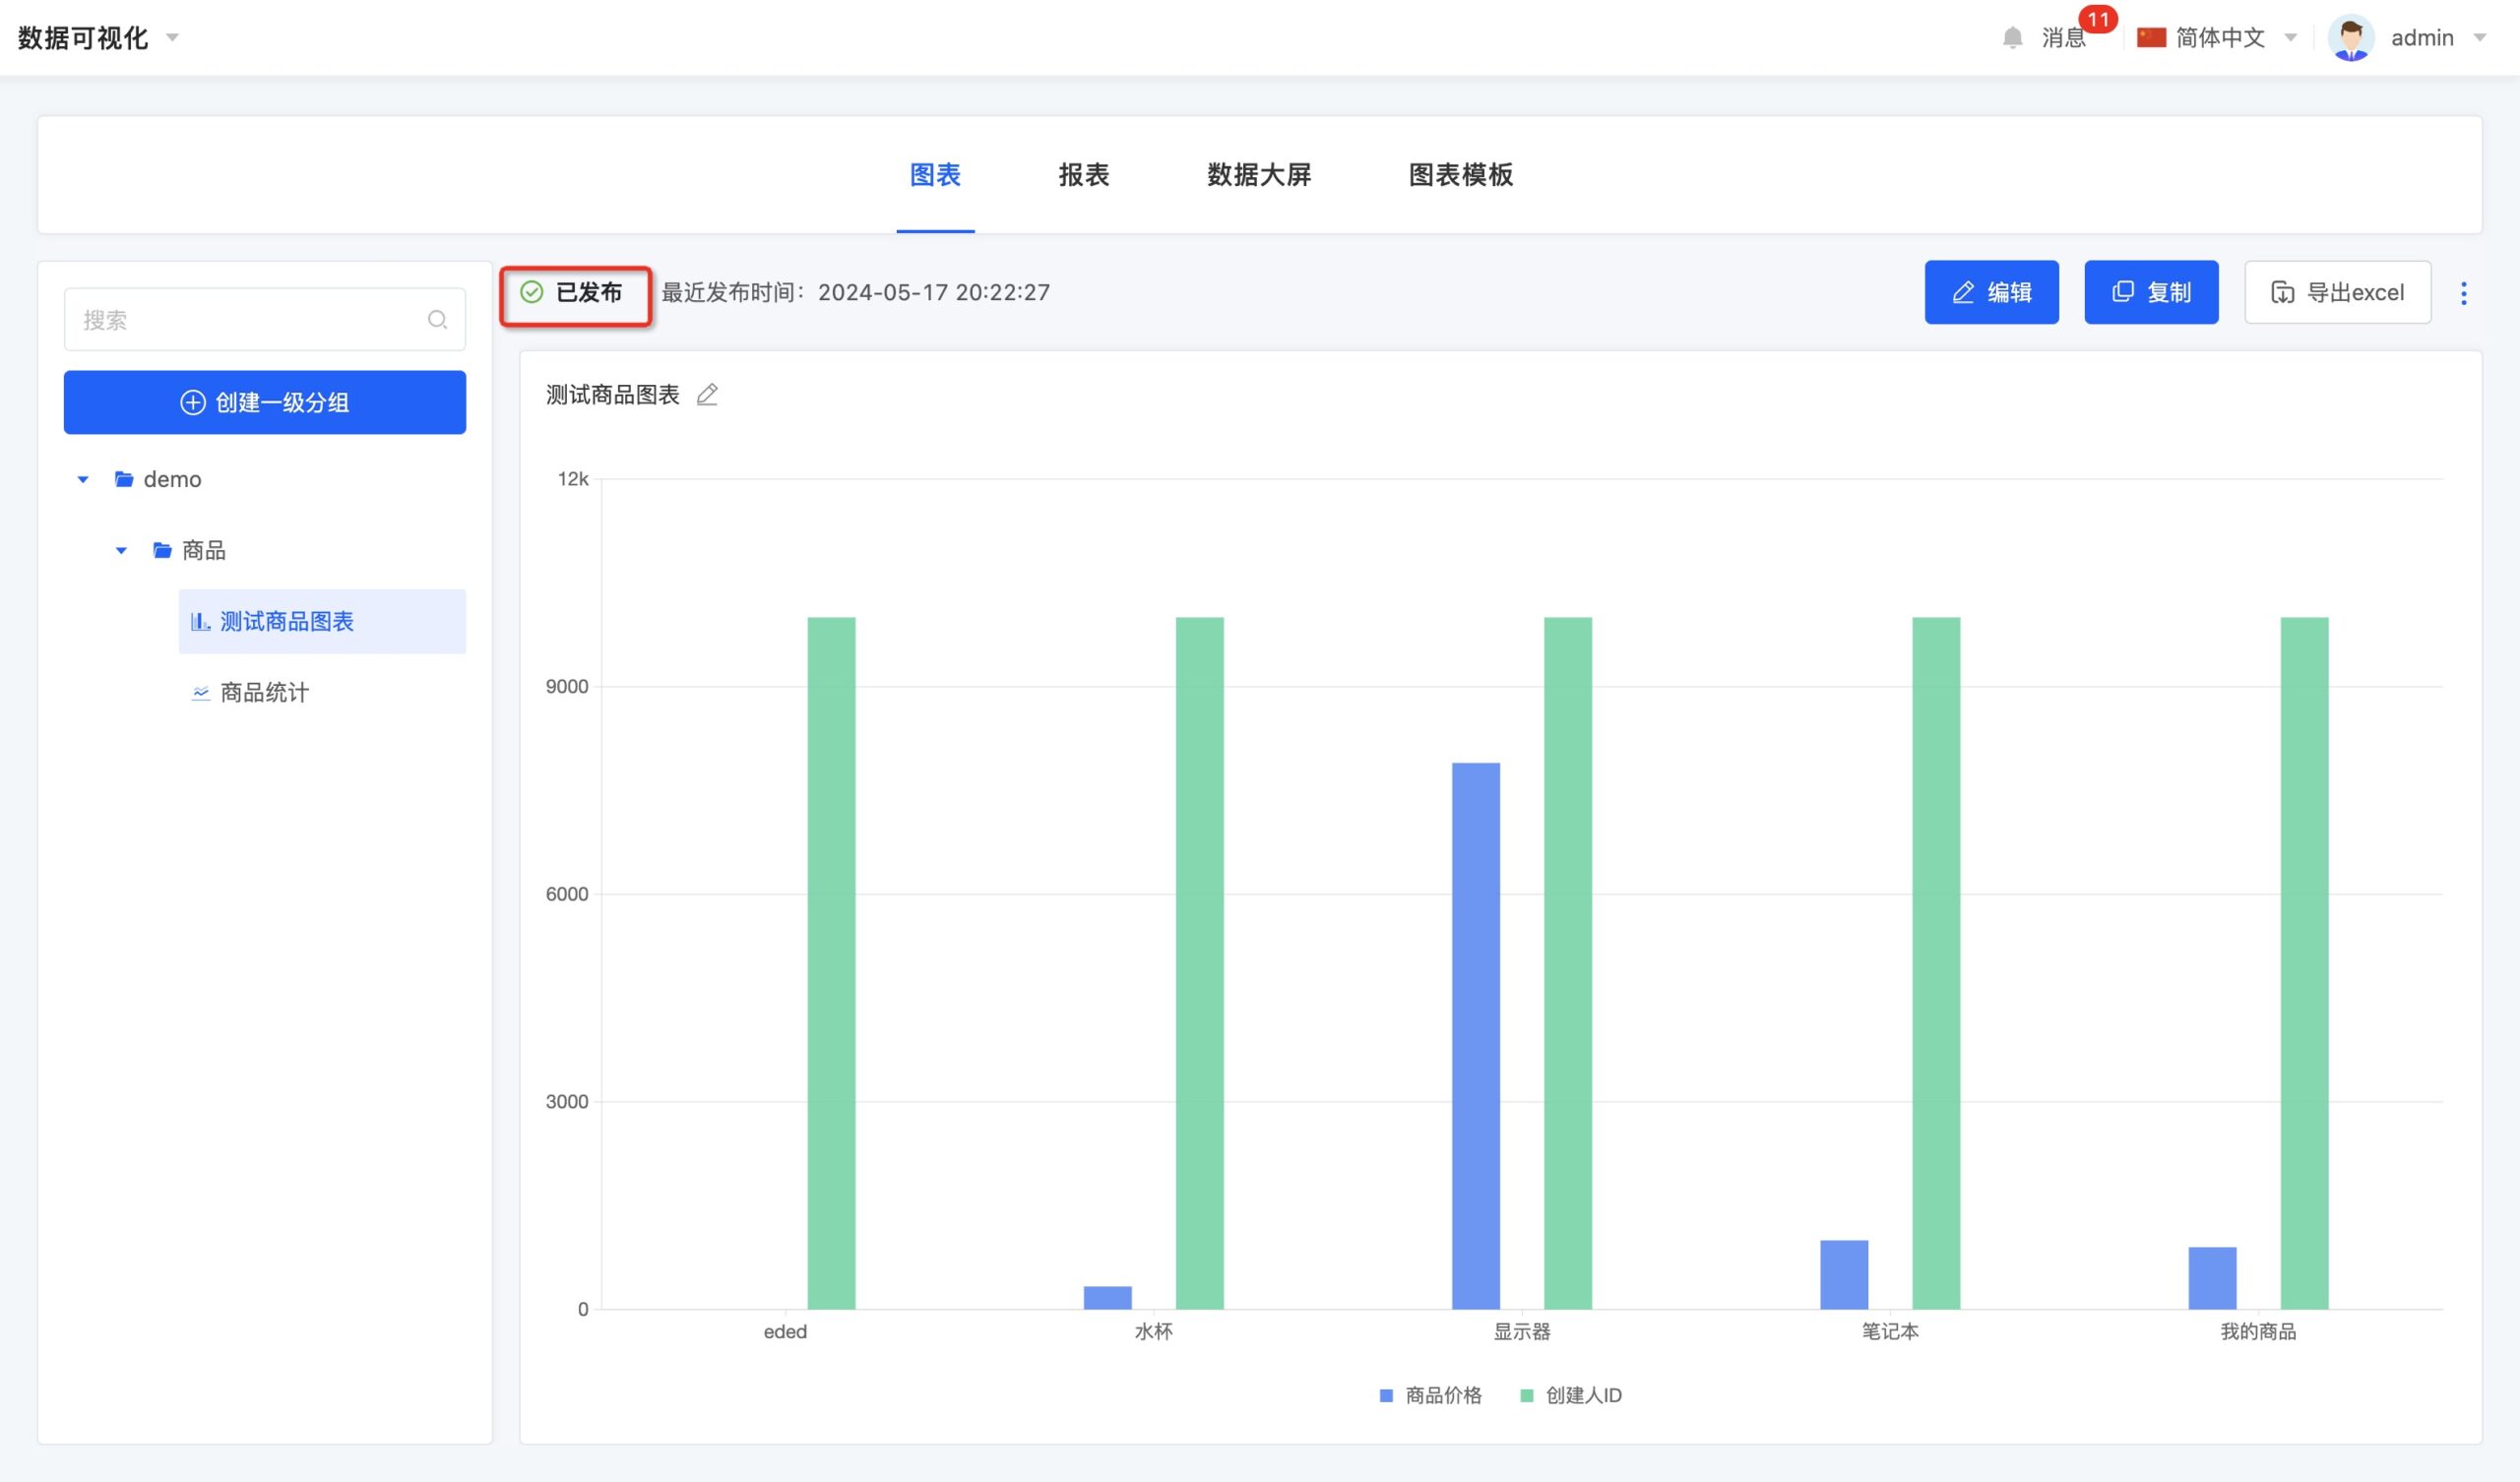 The same applies to reports.
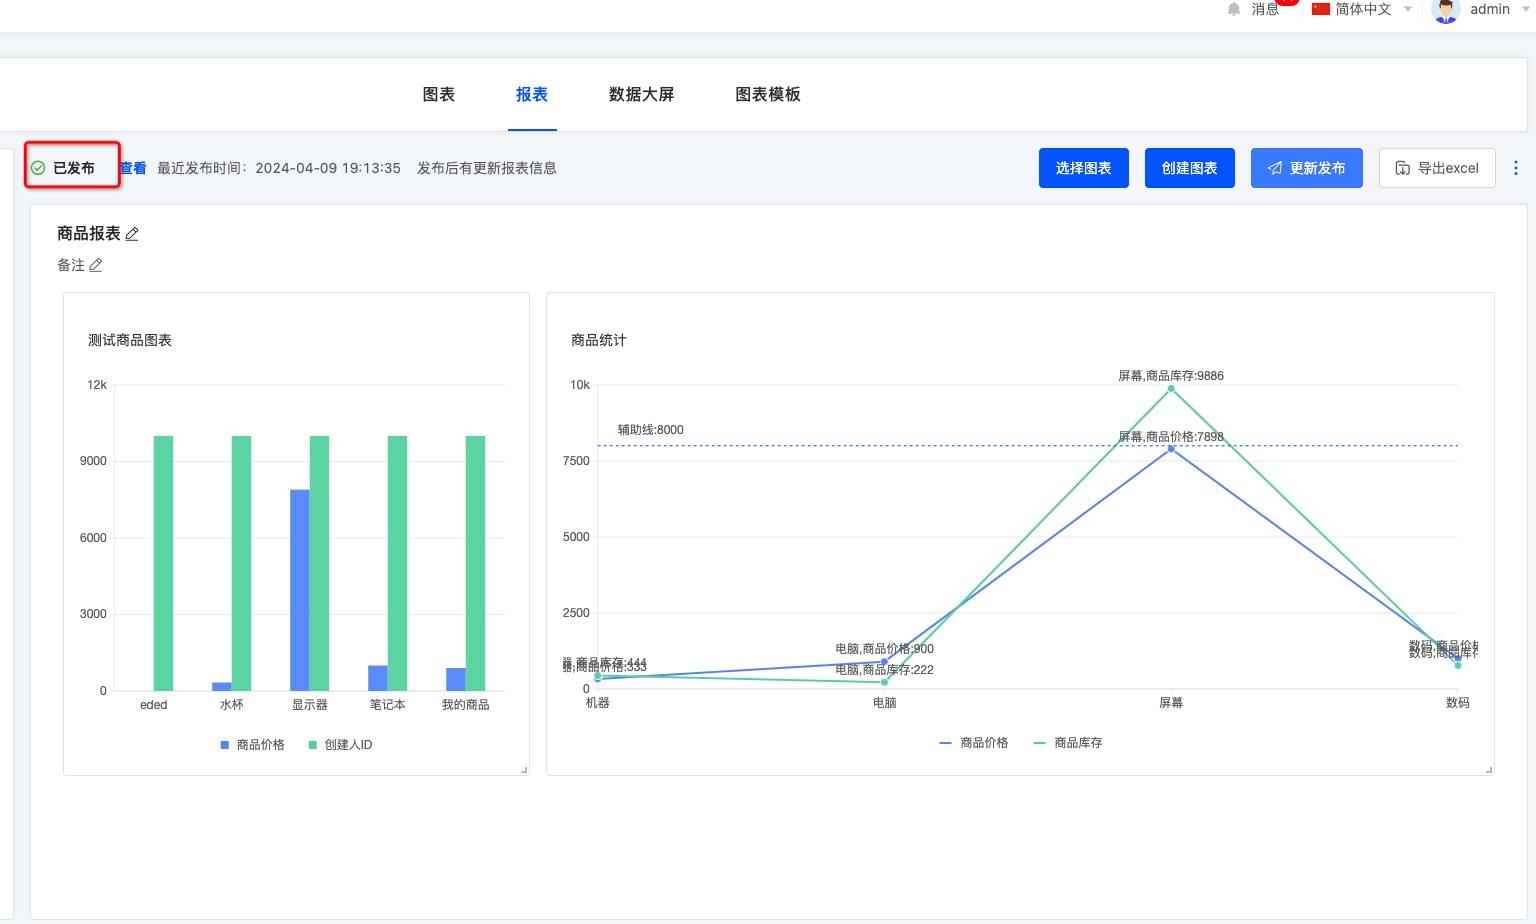
Ⅲ. Displaying Charts, Reports, and Data Dashboards on Pages in the Interface Designer
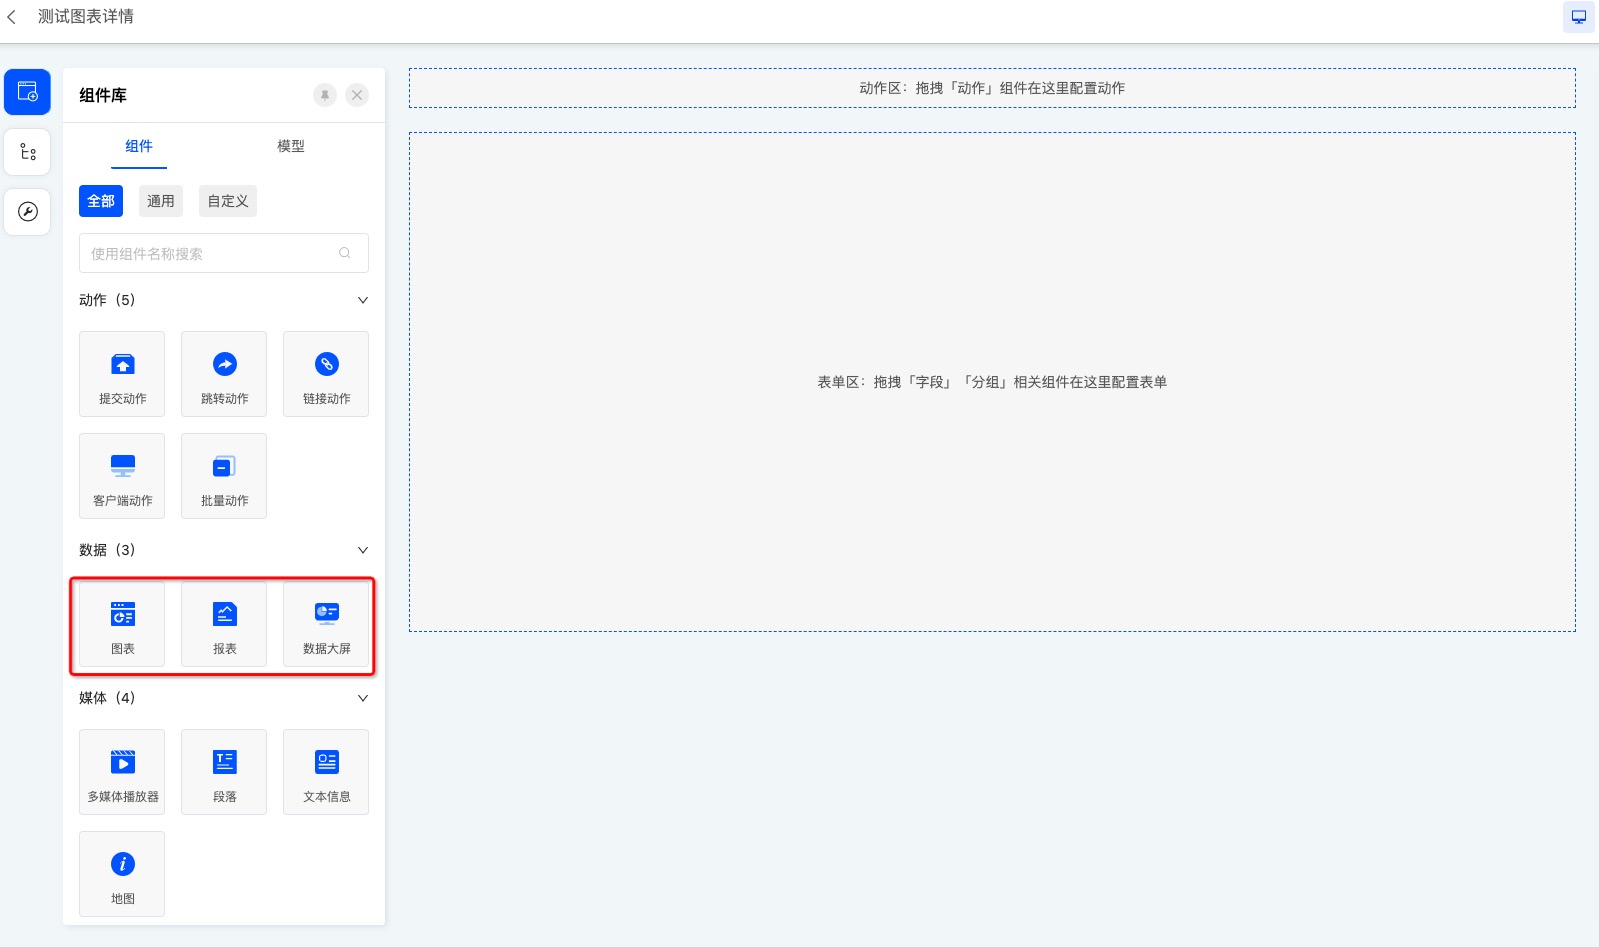 Set the chart and select the corresponding chart.
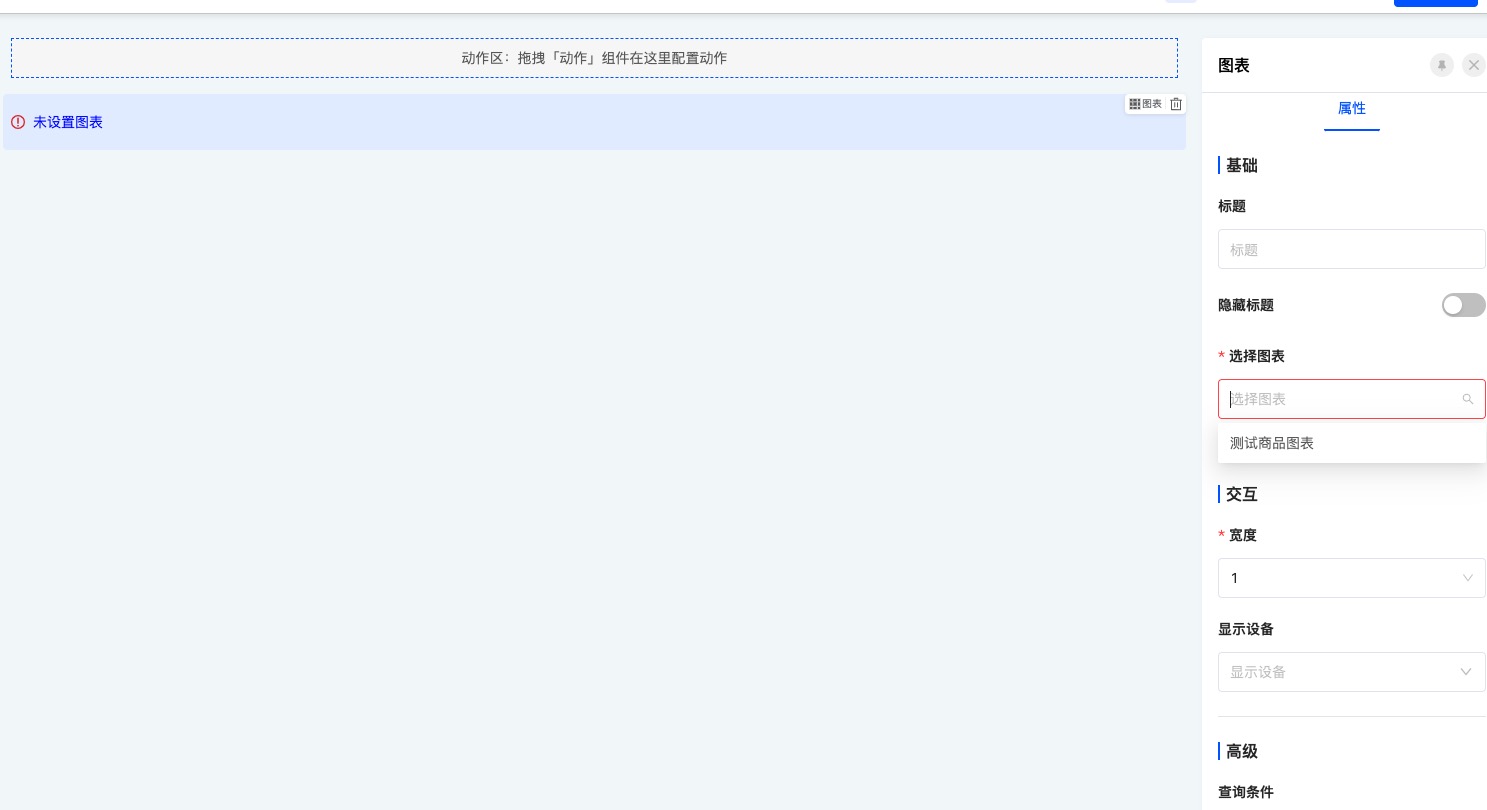
Corresponding charts, reports, and data dashboards can be embedded in form and detail pages. 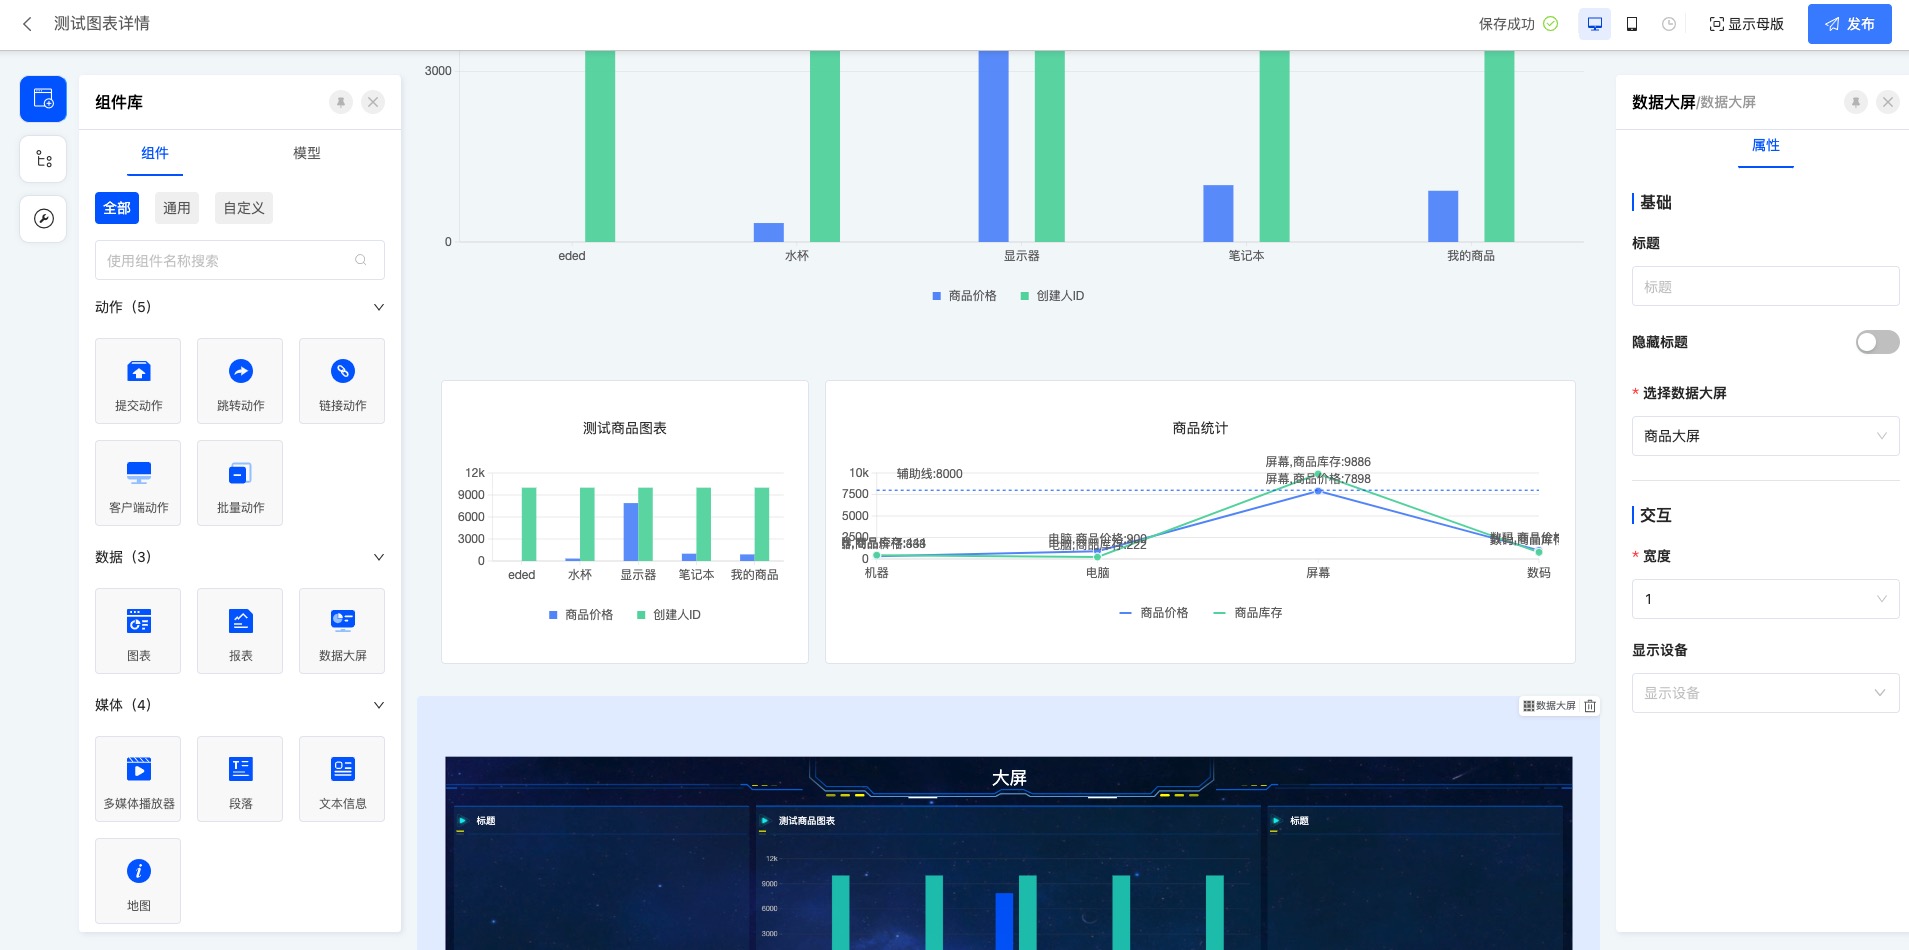
Ⅳ. Updating Charts, Reports, and Data Dashboards
After modifying the chart, it needs to be updated and published so that the latest chart can be updated on the corresponding business page.