When the chart types provided by the system cannot meet actual requirements temporarily, you don't have to be limited by the existing options. You can add custom chart types independently. With this feature, you can introduce more diverse chart types according to specific business needs or data presentation requirements, thereby enriching the forms of data visualization and making data presentation more appropriate and intuitive.
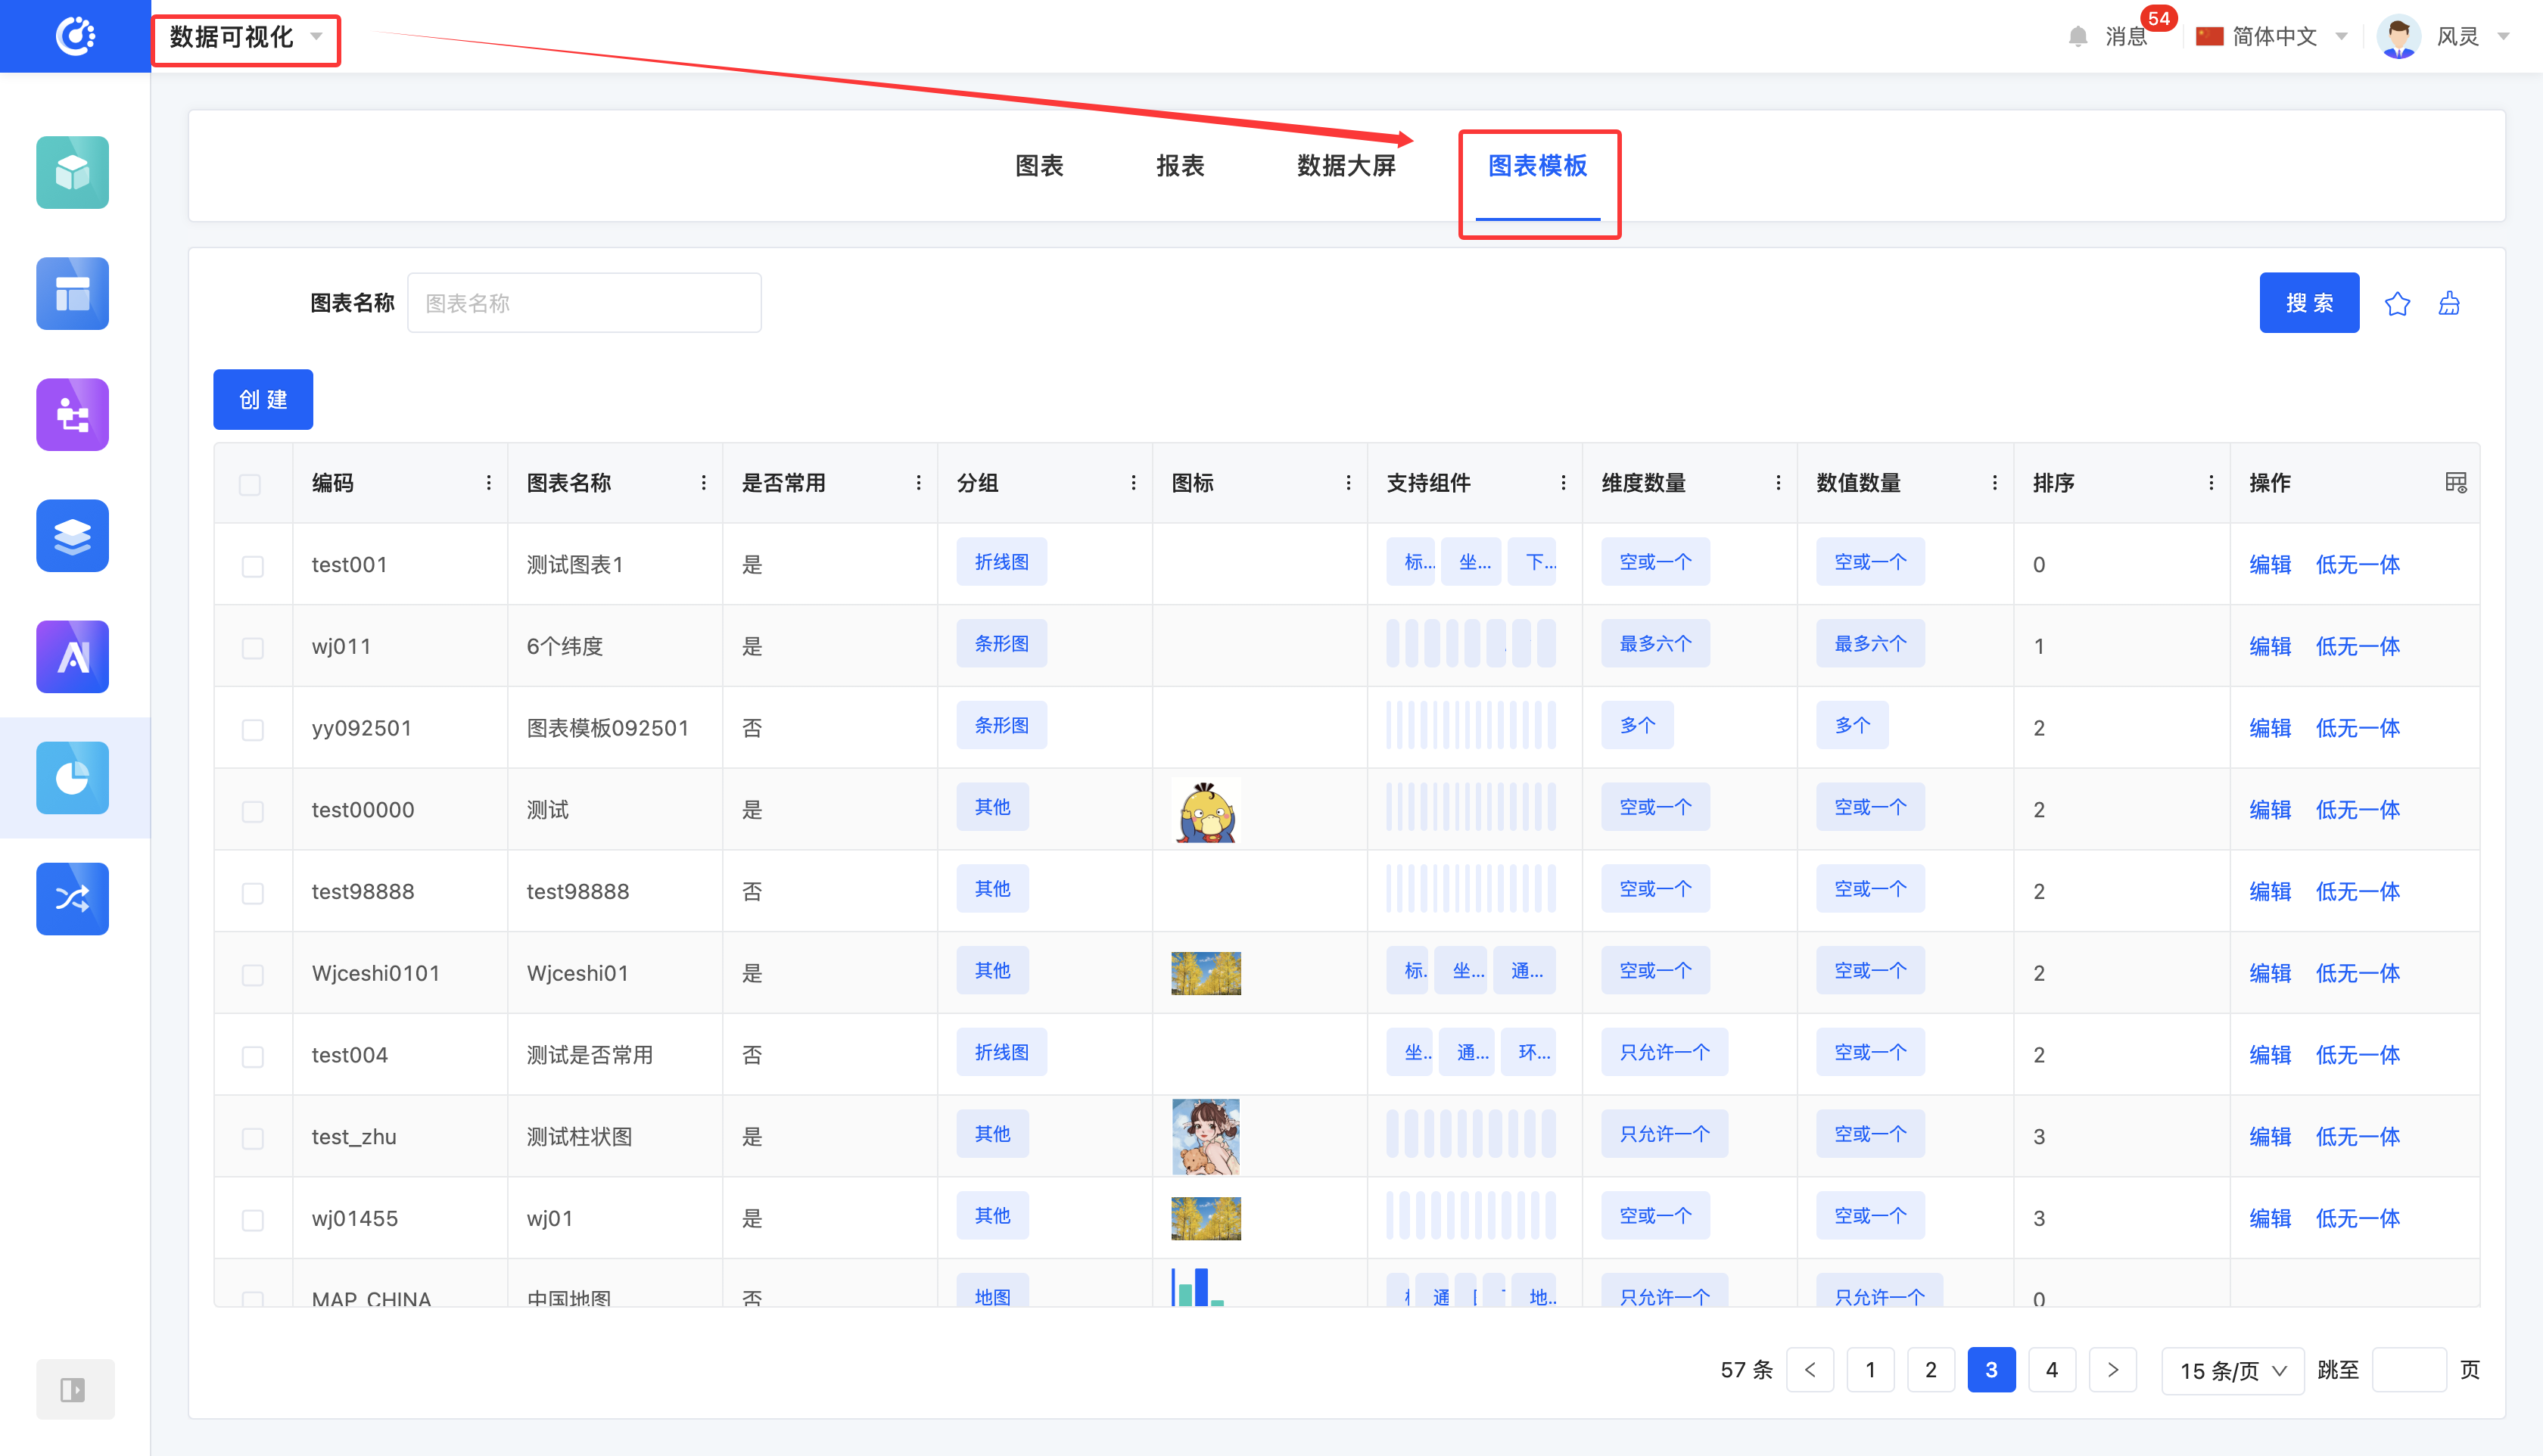
Navigate to the "Chart Template" page of data visualization to manage custom chart templates.
I. Filtering
1. Function Introduction
You can customize the filtering conditions for chart templates according to actual business needs. Under the current filtering conditions, the corresponding list of chart templates will be displayed, facilitating the viewing and editing of different chart templates.
Tip
You can save frequently used combinations of filter options as filter schemes. Subsequently, you can directly select a filter scheme to filter chart templates with a single click.
2. Operation Method
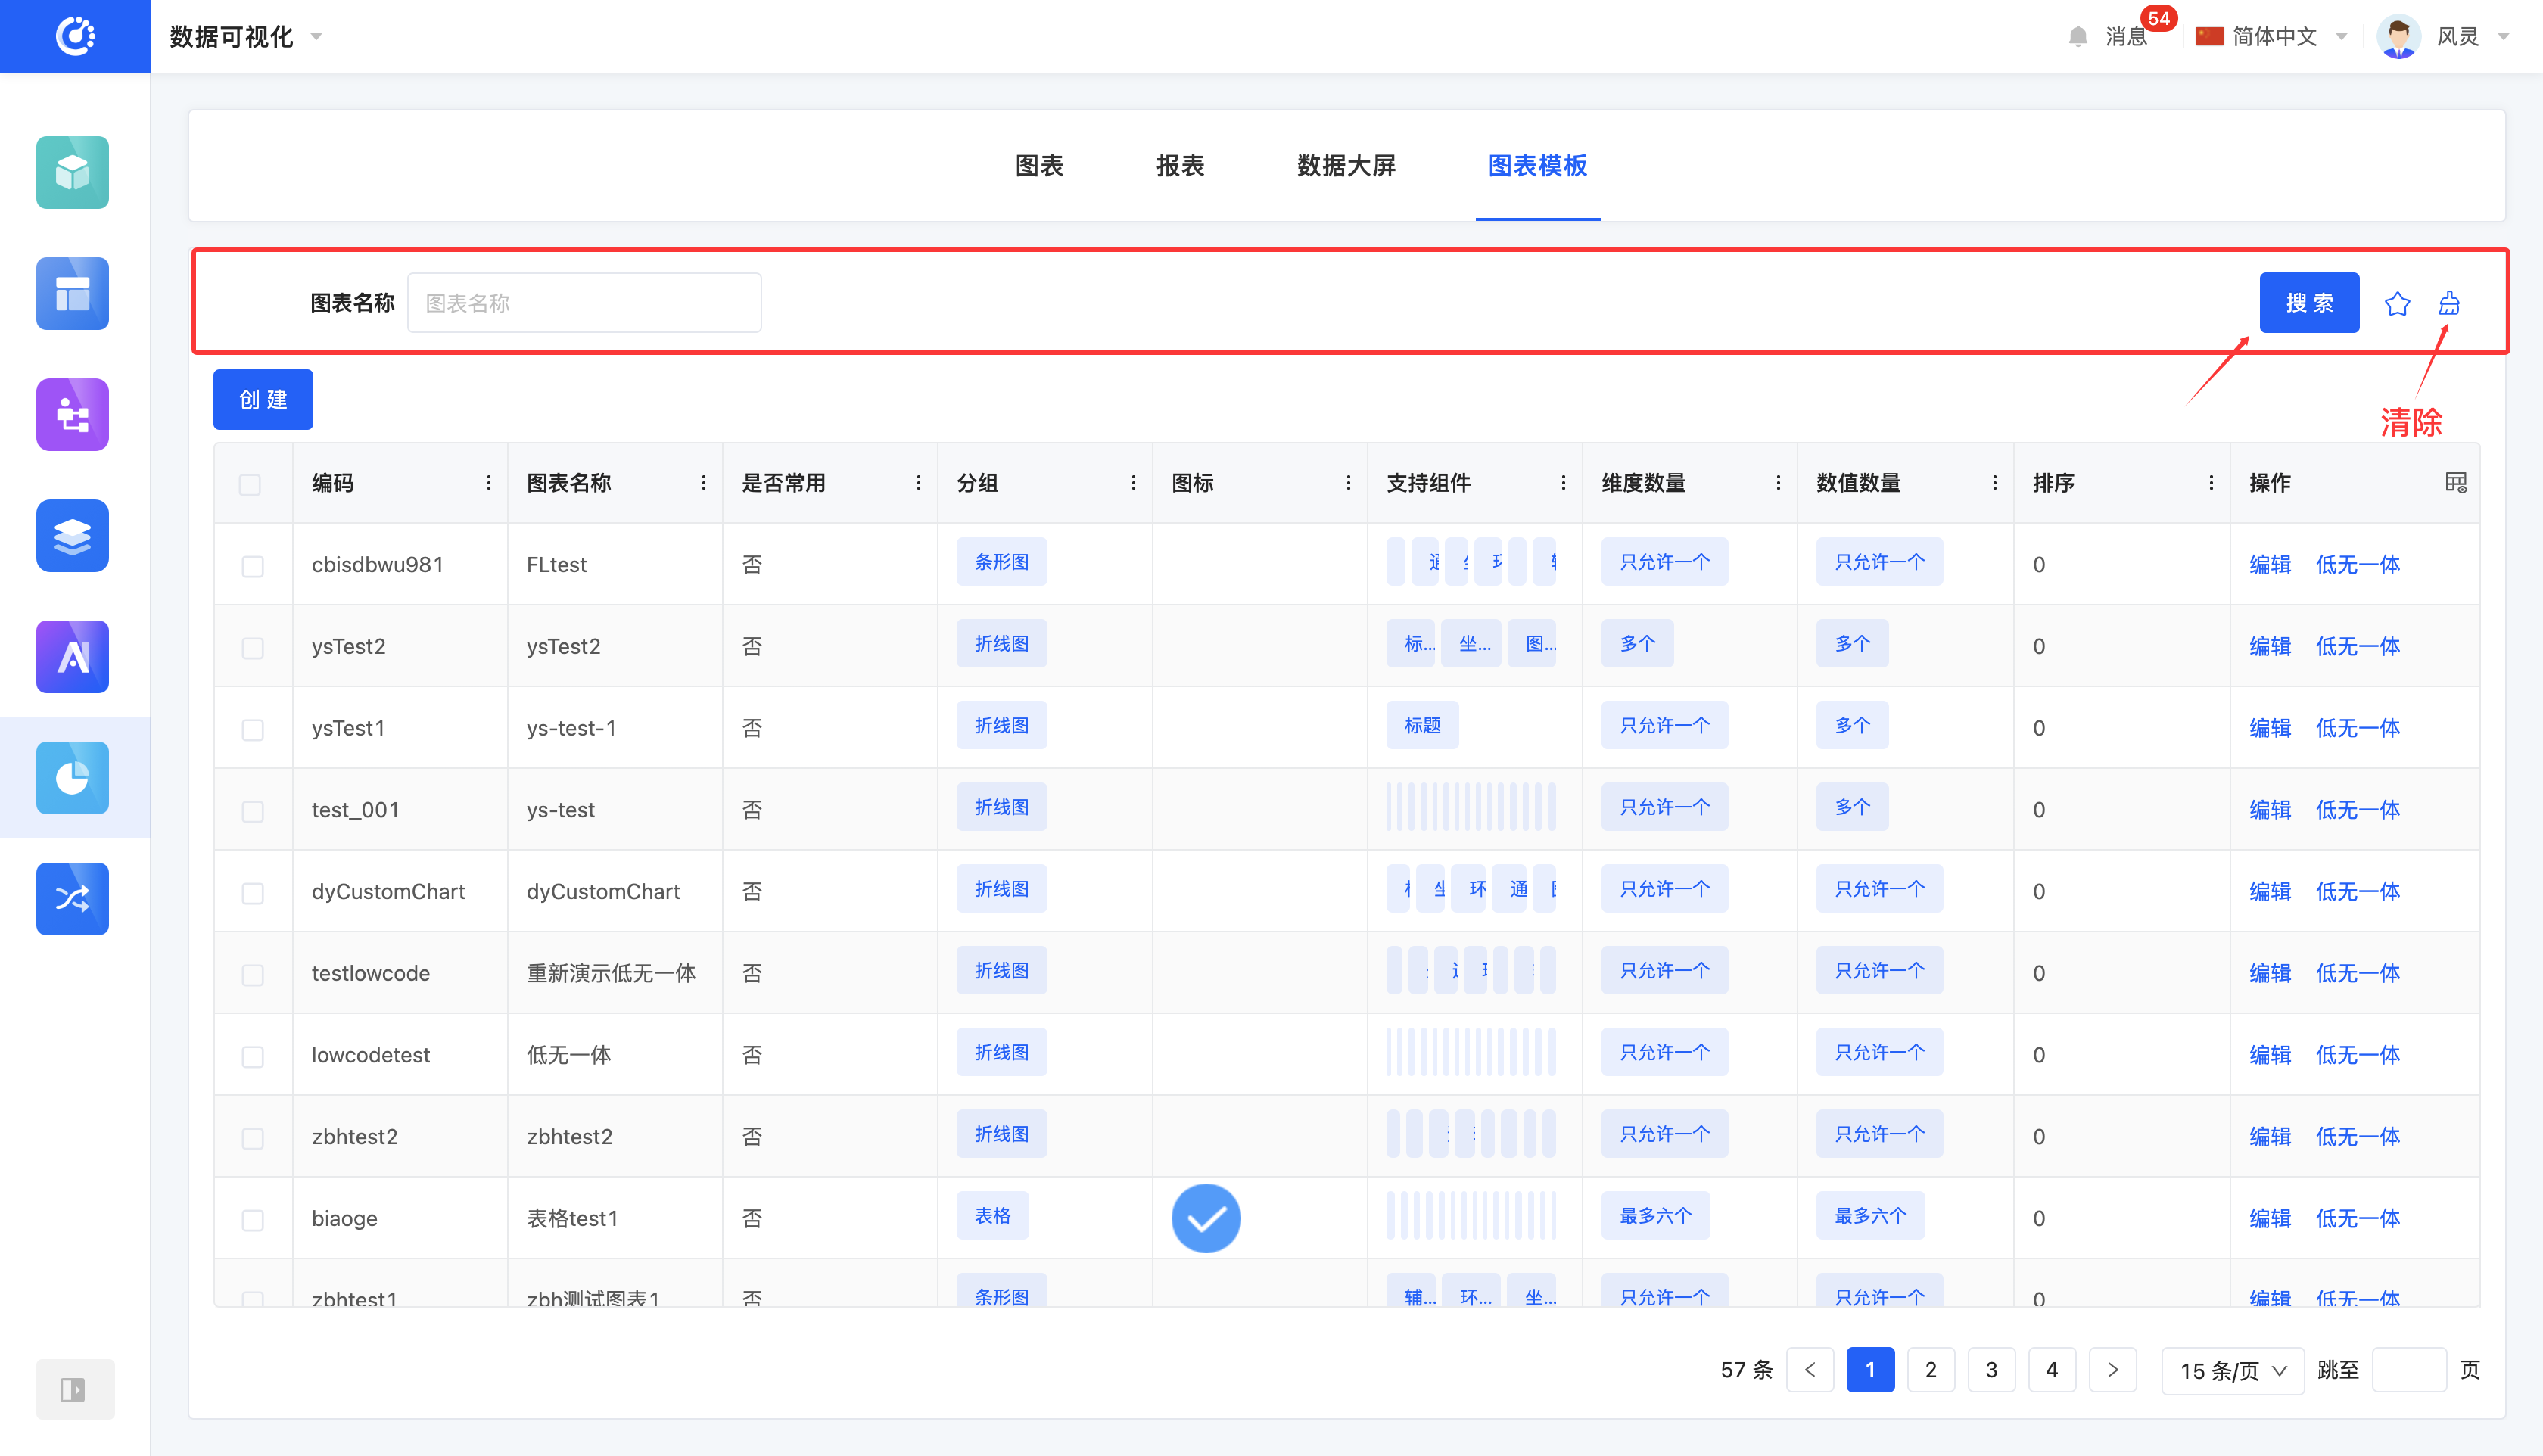
- Filter: Enter conditions in the filtering area and click "Search" to filter chart templates.
- Clear All: Click the "Clear" icon to clear all conditions in the current filtering area at once.
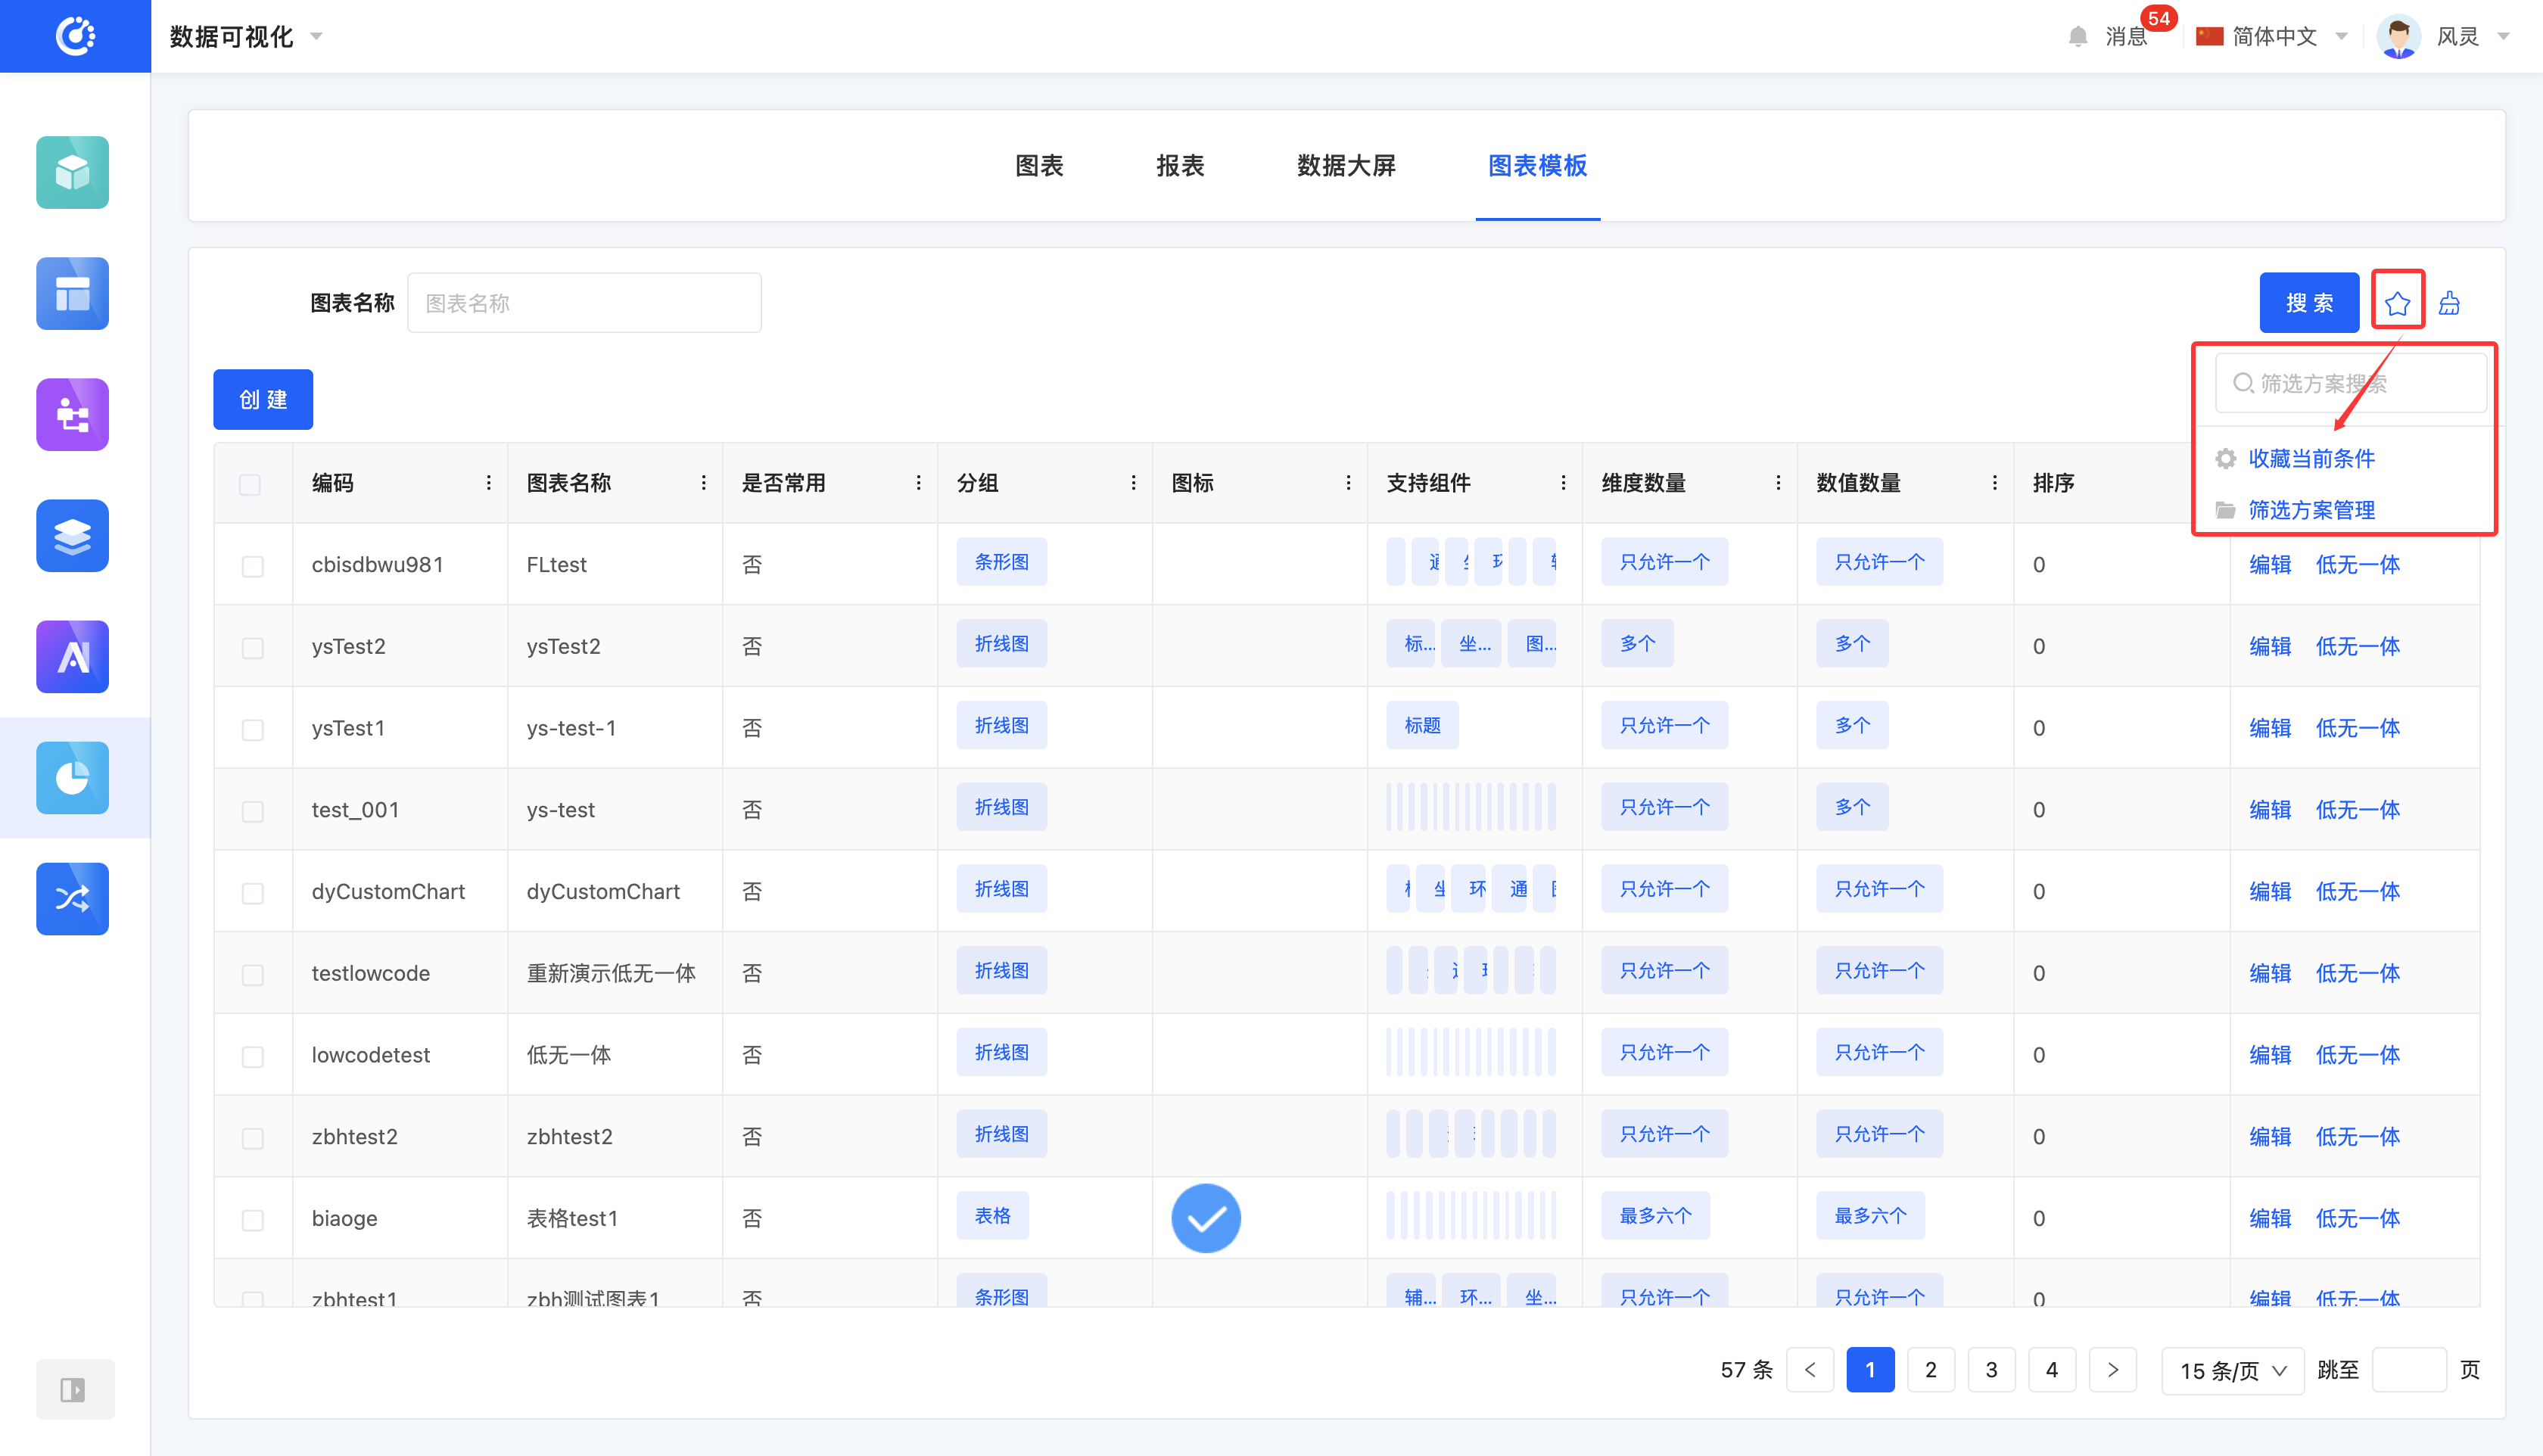
- Manage Filter Schemes: Hover the mouse over the "Filter Schemes" icon to manage filter schemes.
- Add: After selecting or entering filter conditions in the filtering area, click "Save Current Conditions". Enter a scheme name in the pop-up window to add the current combination of filter conditions to the filter schemes.
- Search: Enter a scheme name in the input box.
- Modify: Click "Manage Filter Schemes", select a scheme in the pop-up window, and click the scheme name to modify it.
- Delete: Select a scheme in the scheme list and click the "Delete" icon to delete the filter scheme.
II. Create a Chart Template
1. Function Introduction
Custom chart templates are supported. You can set attributes such as the name, icon, and group for a chart.
- Group: When designing a chart, you can find the custom chart template in the corresponding group.
- Frequently Used: If this feature is enabled, the template will be added to the "Frequently Used Types" when designing a chart, facilitating quick selection.
- Sorting: You can set the sorting order for a chart to manage chart templates in an orderly manner according to your needs.
- Dimension Count: You can limit the number of dimensions for a chart.
- Value Count: You can limit the number of values for a chart.
- Supported Components: These are the style options compatible with the template. After selection, you can apply these styles in the style bar of the template.
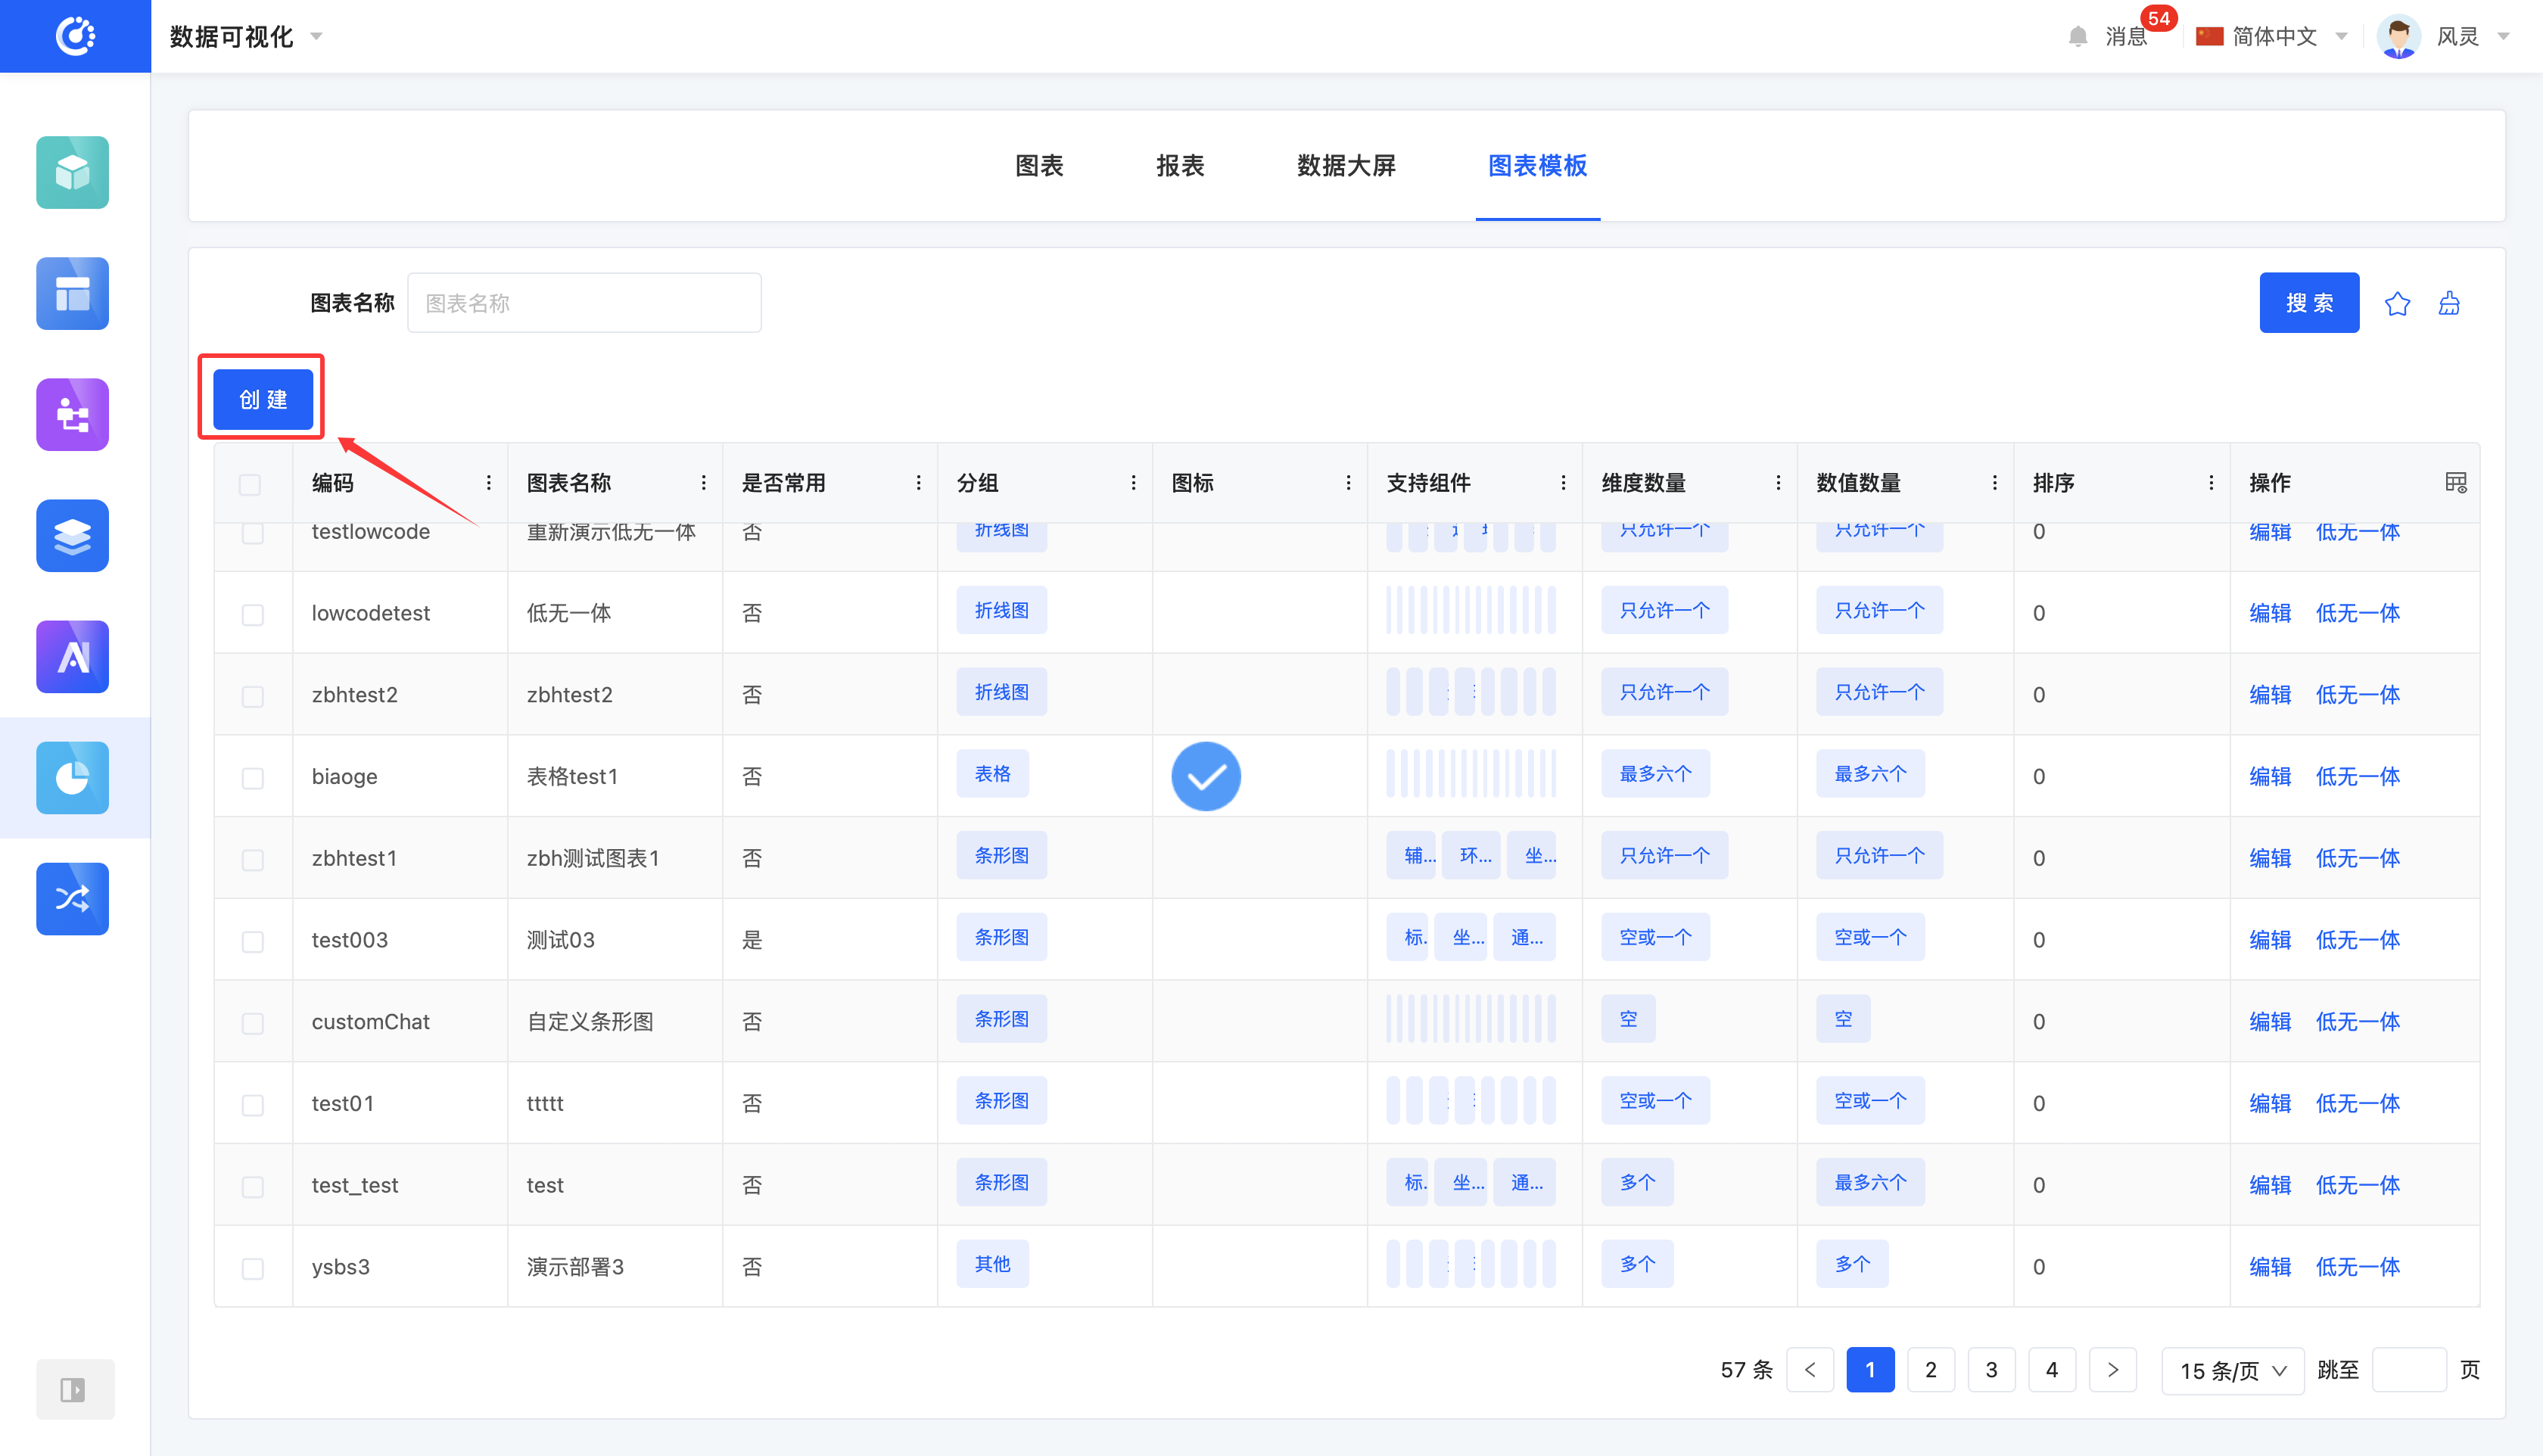
2. Operation Method
Click "Create", fill in the information according to actual needs in the pop-up window, and click "OK" to create the chart template successfully.
III. Edit a Chart Template
1. Function Introduction
Successfully created chart templates can be edited.
Note
Only some information can be modified. Some information is fixed at the time of creation, so please fill it out carefully when creating.
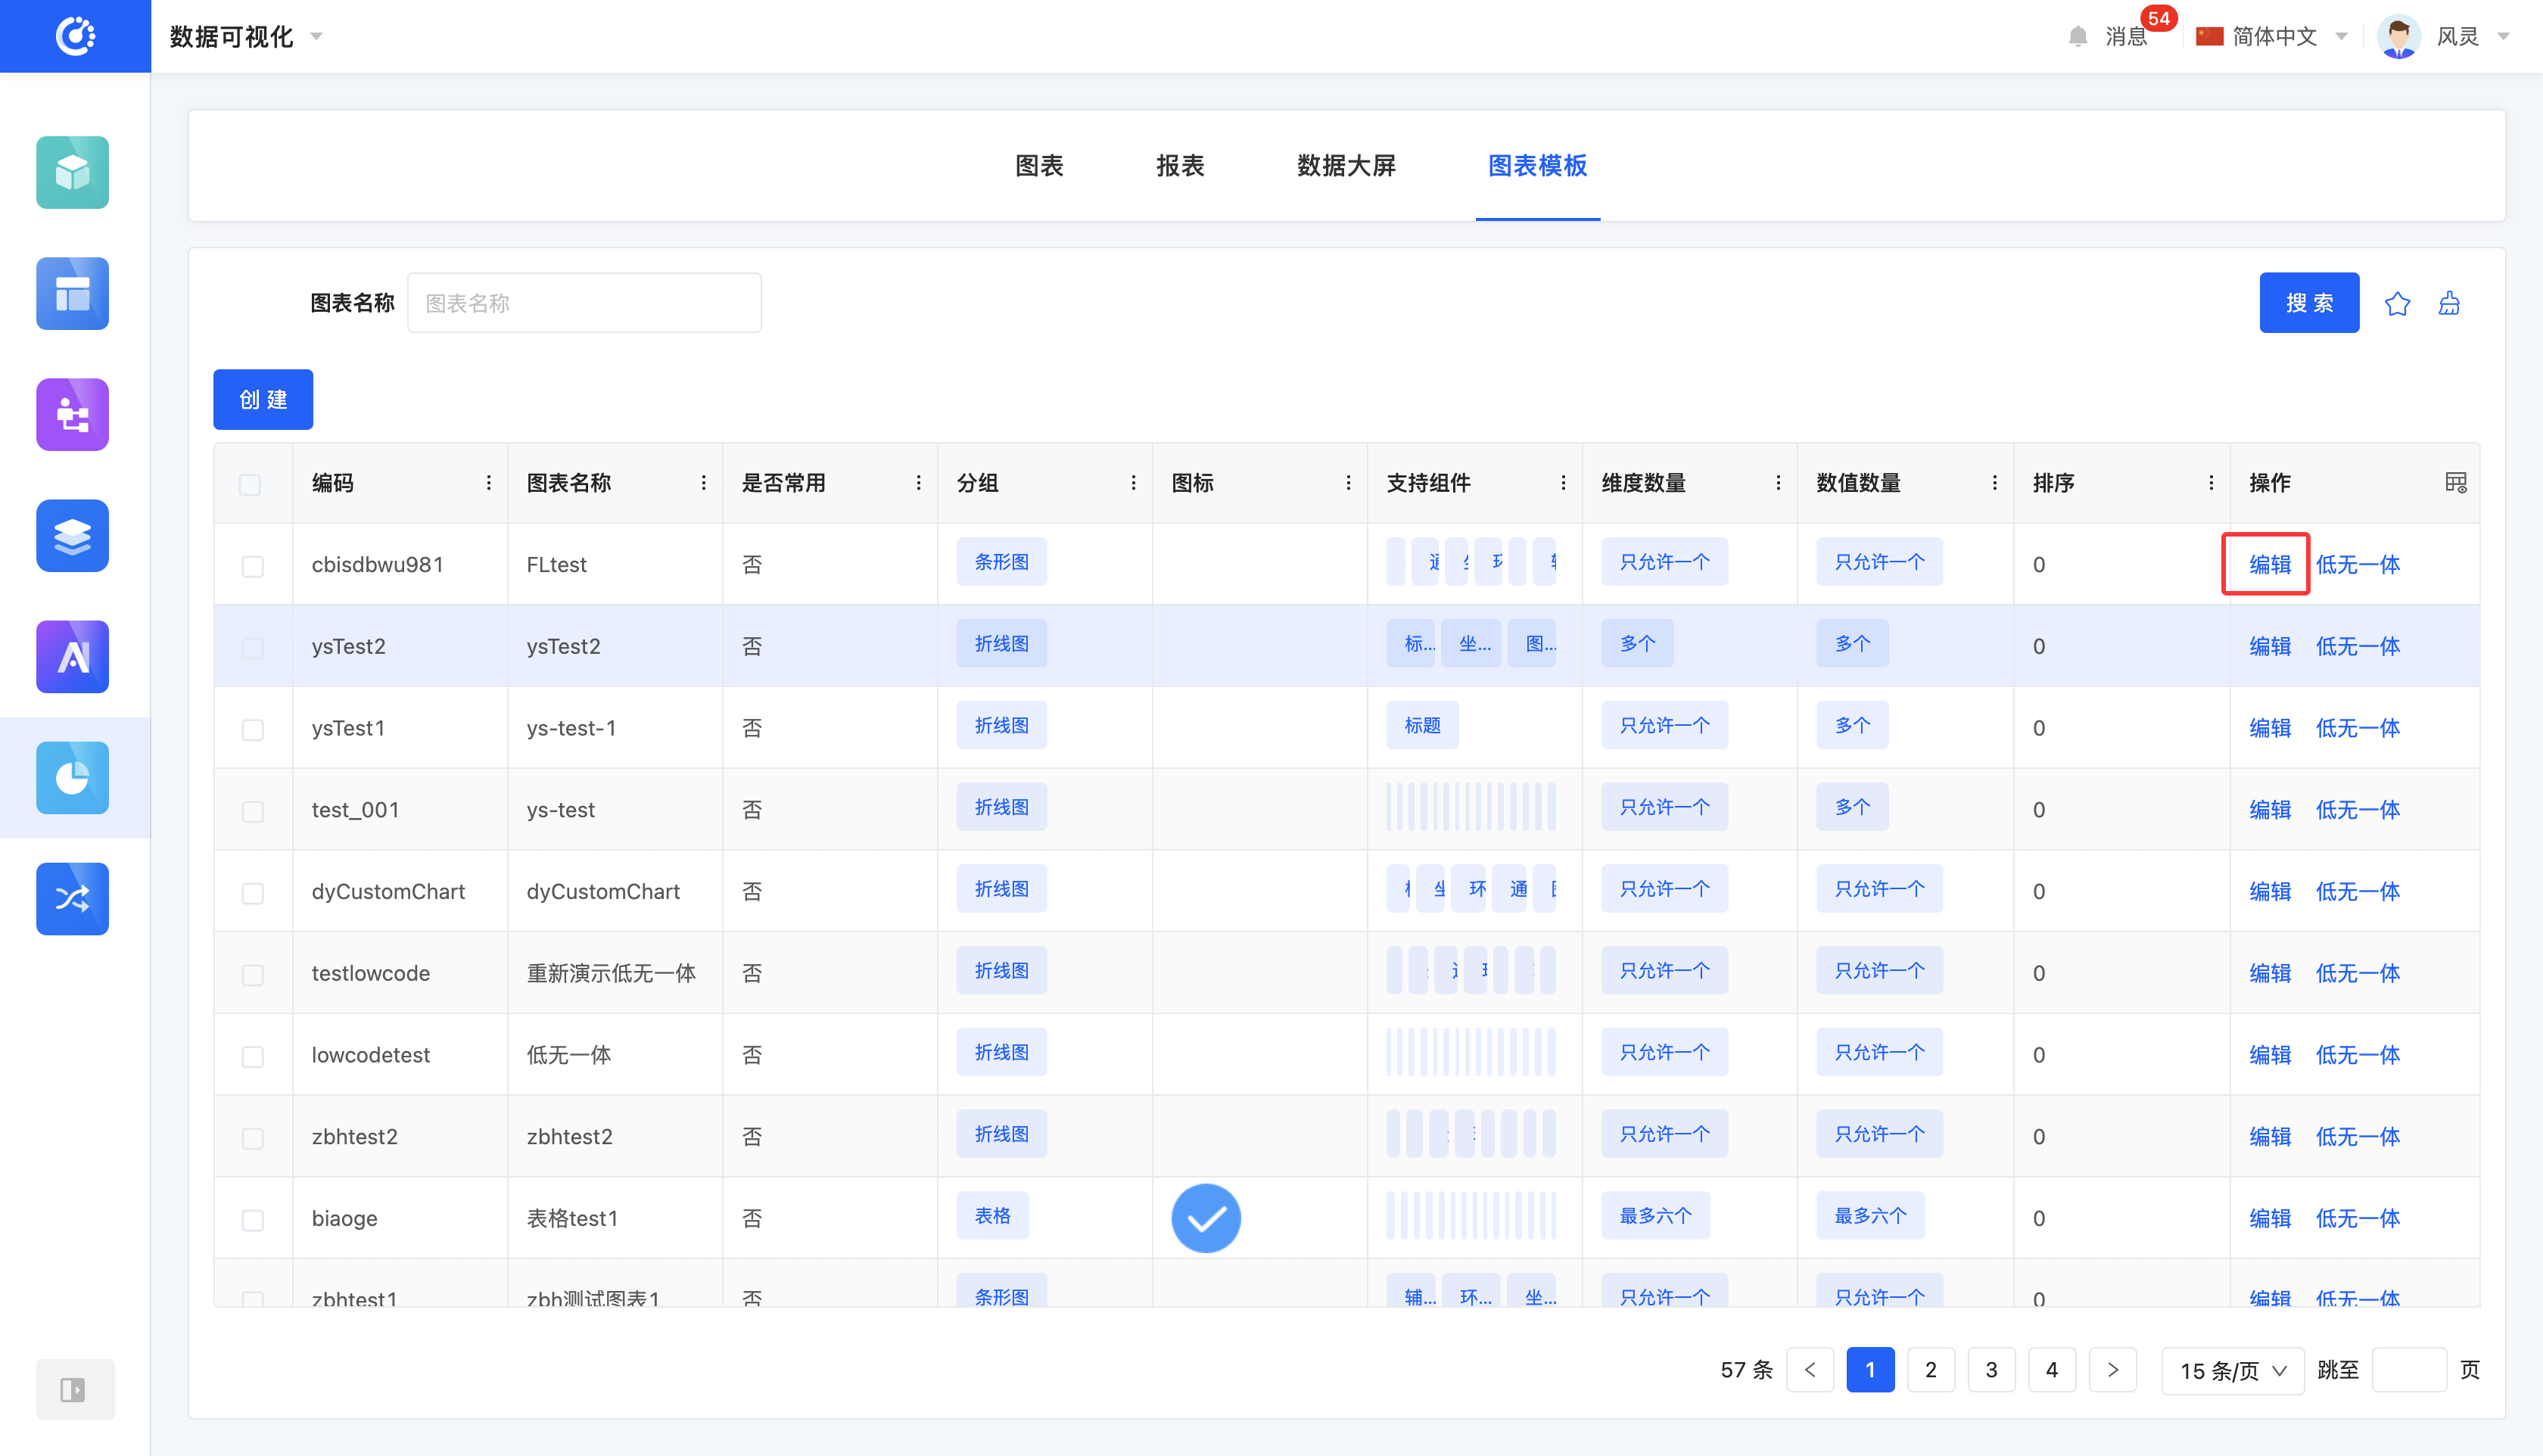
2. Operation Method
Click "Edit" to edit the chart template in the pop-up editing page.
IV. Low-Code and No-Code Integration
1. Function Introduction
When no-code design of chart templates cannot meet the development needs of certain special scenarios or cannot perfect related functions, you can use the low-code and no-code integration feature to further improve and optimize the project by writing code.
Tip
The system supports all custom components to have the low-code and no-code integration feature. To facilitate code management and reduce the number of network requests, it is recommended to centrally upload low-code development files in one component. There is no difference in effect between unified upload and individual upload, but unified upload can manage code more efficiently and effectively avoid the network request burden caused by too many files.
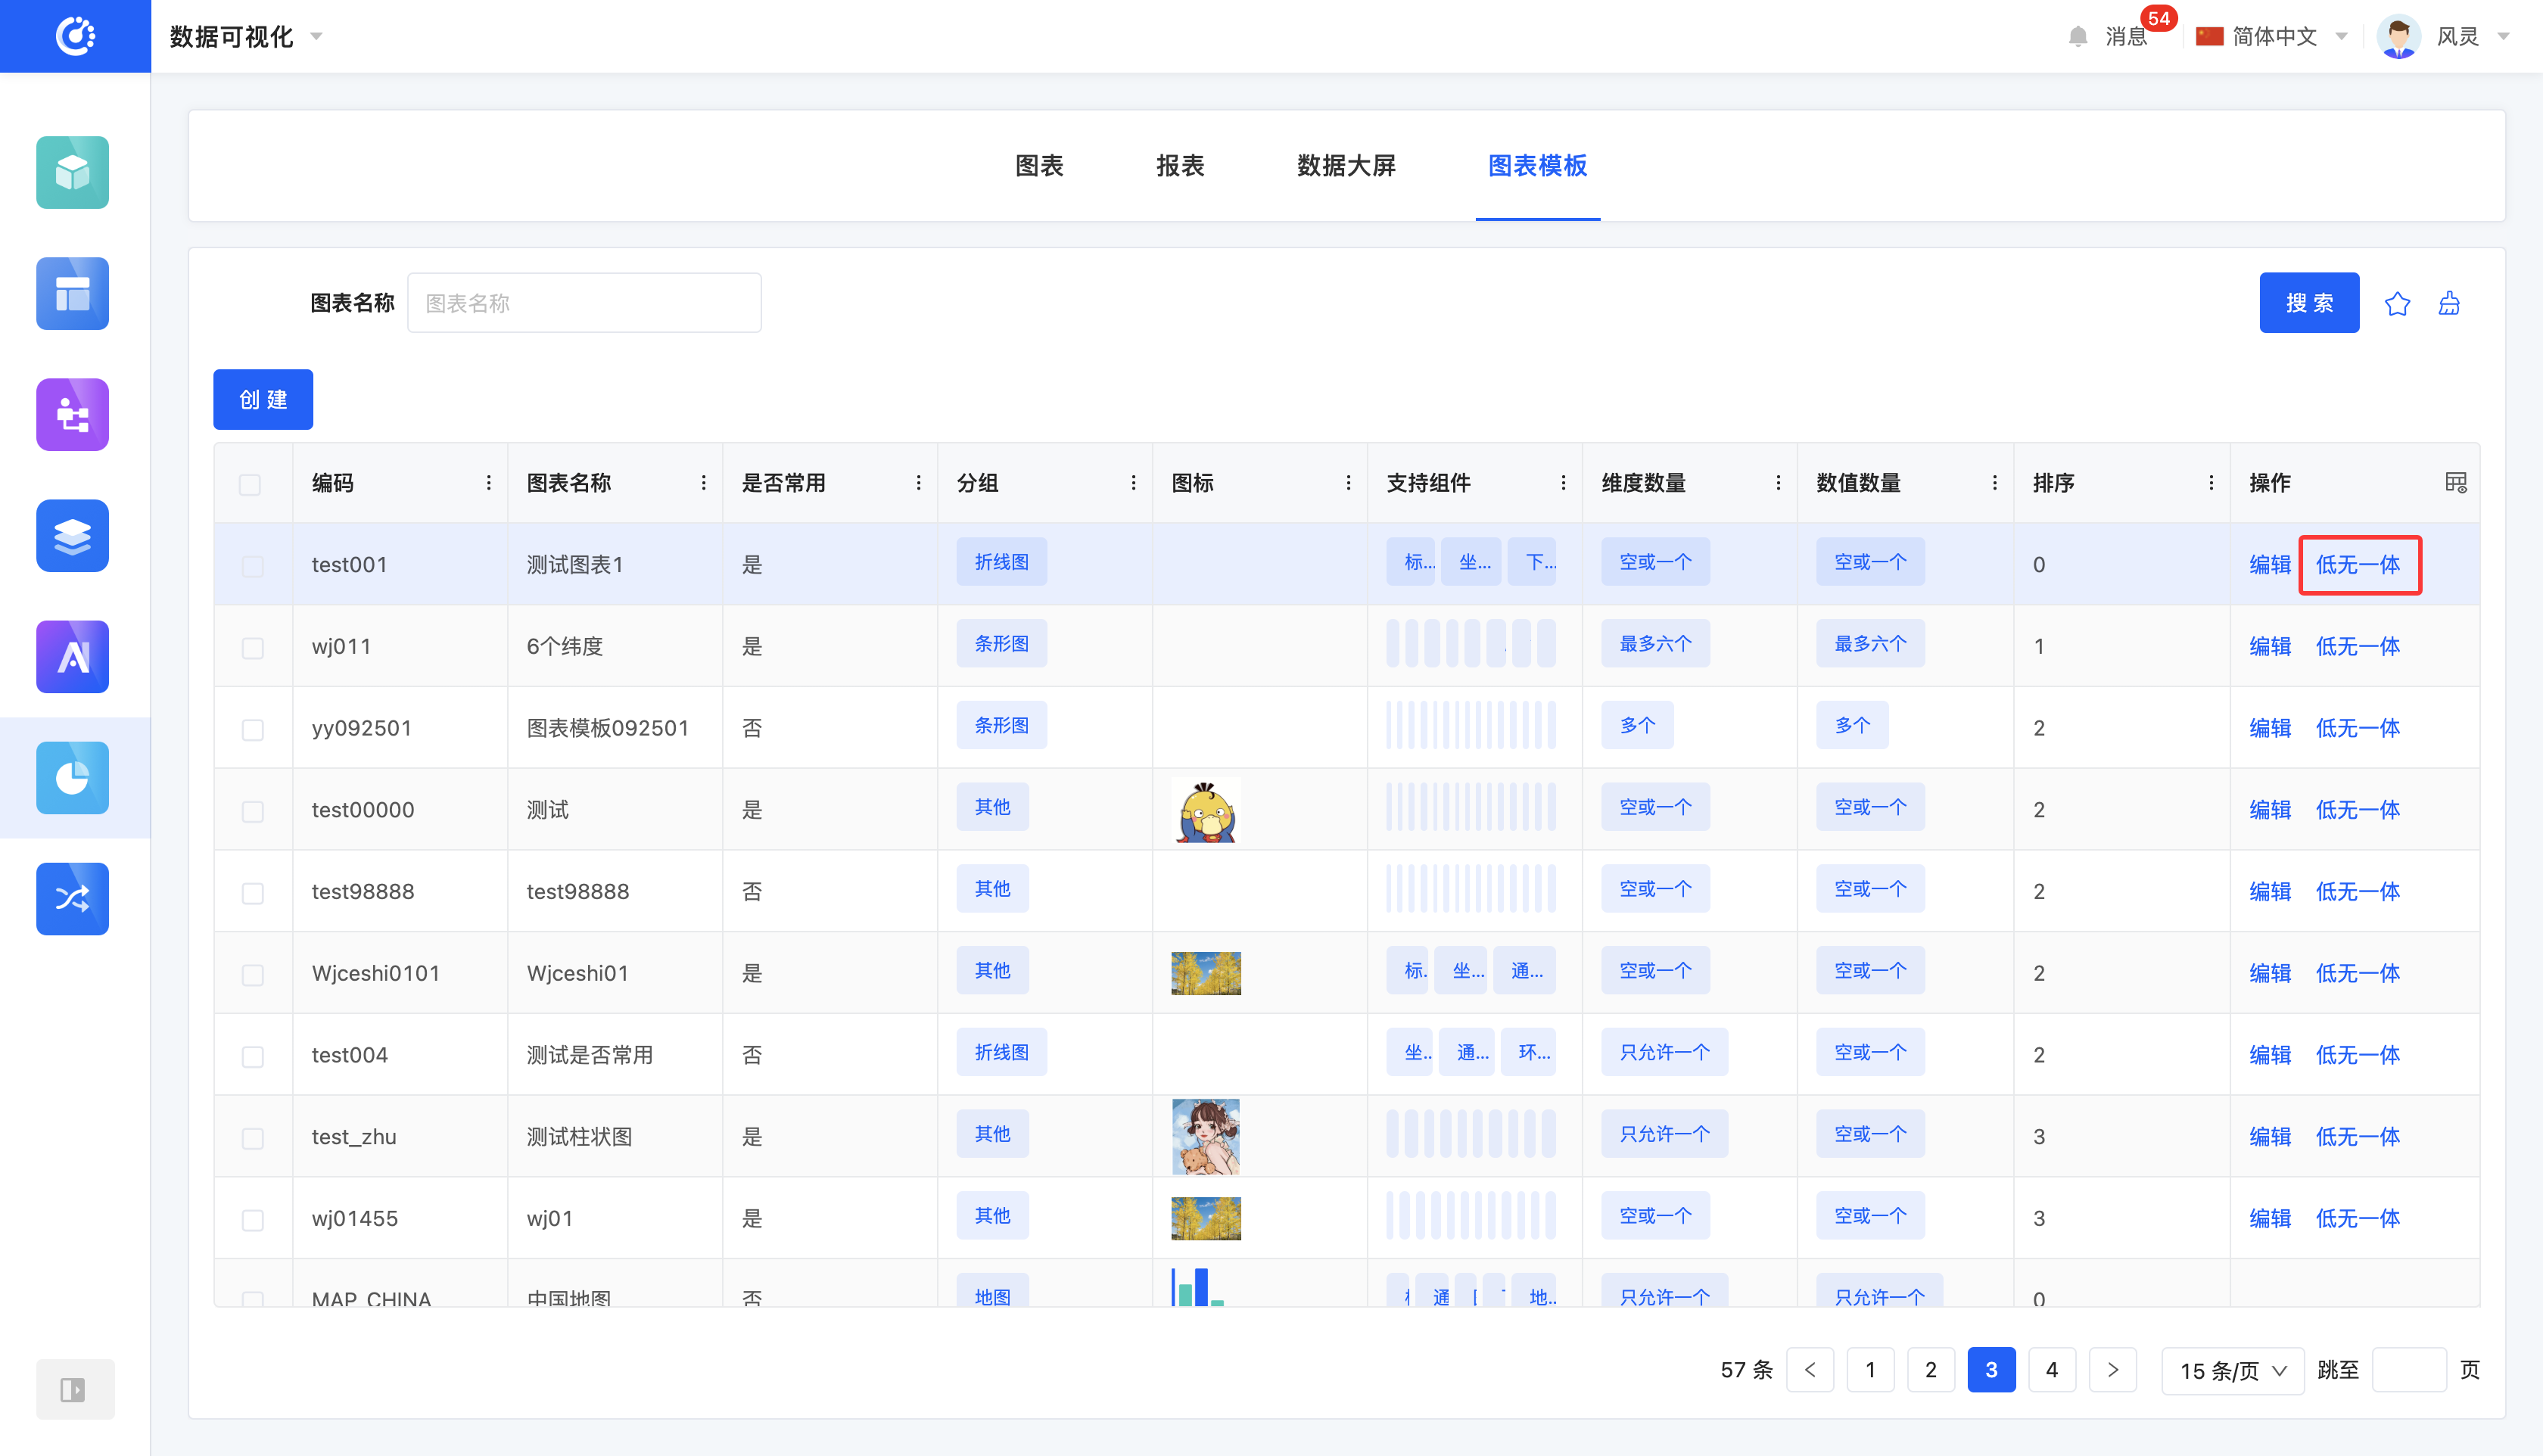
2. Operation Method
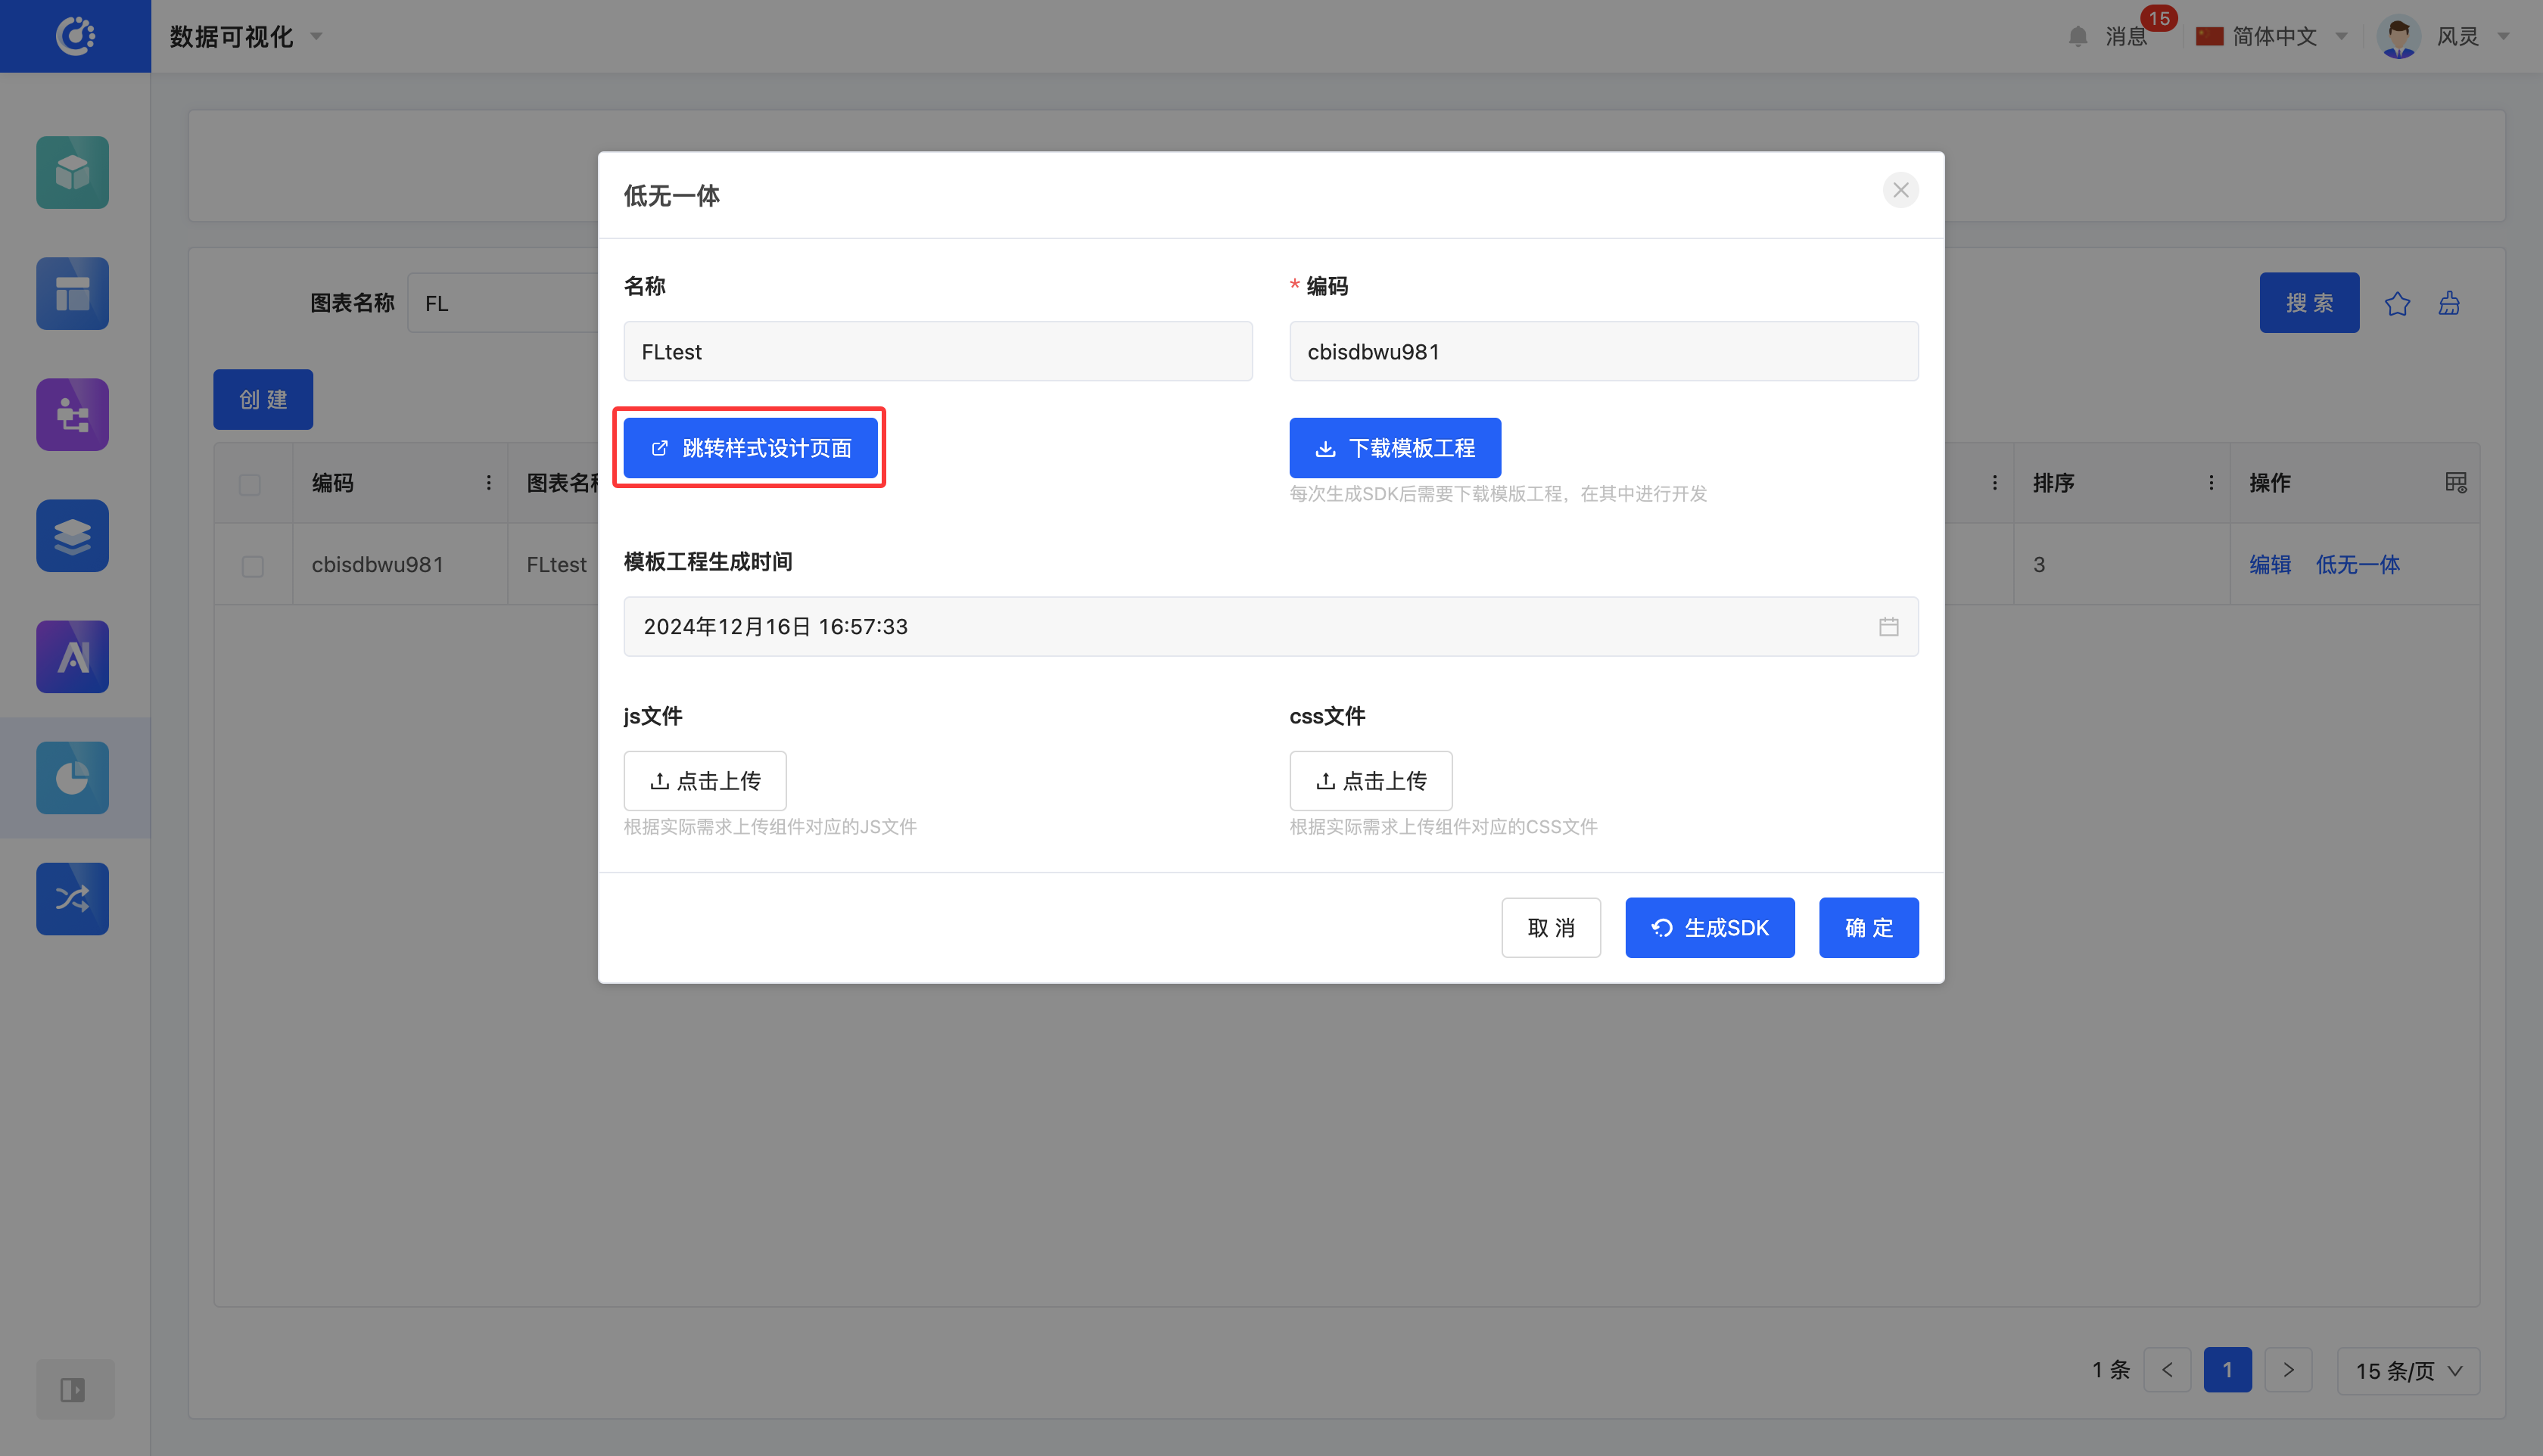
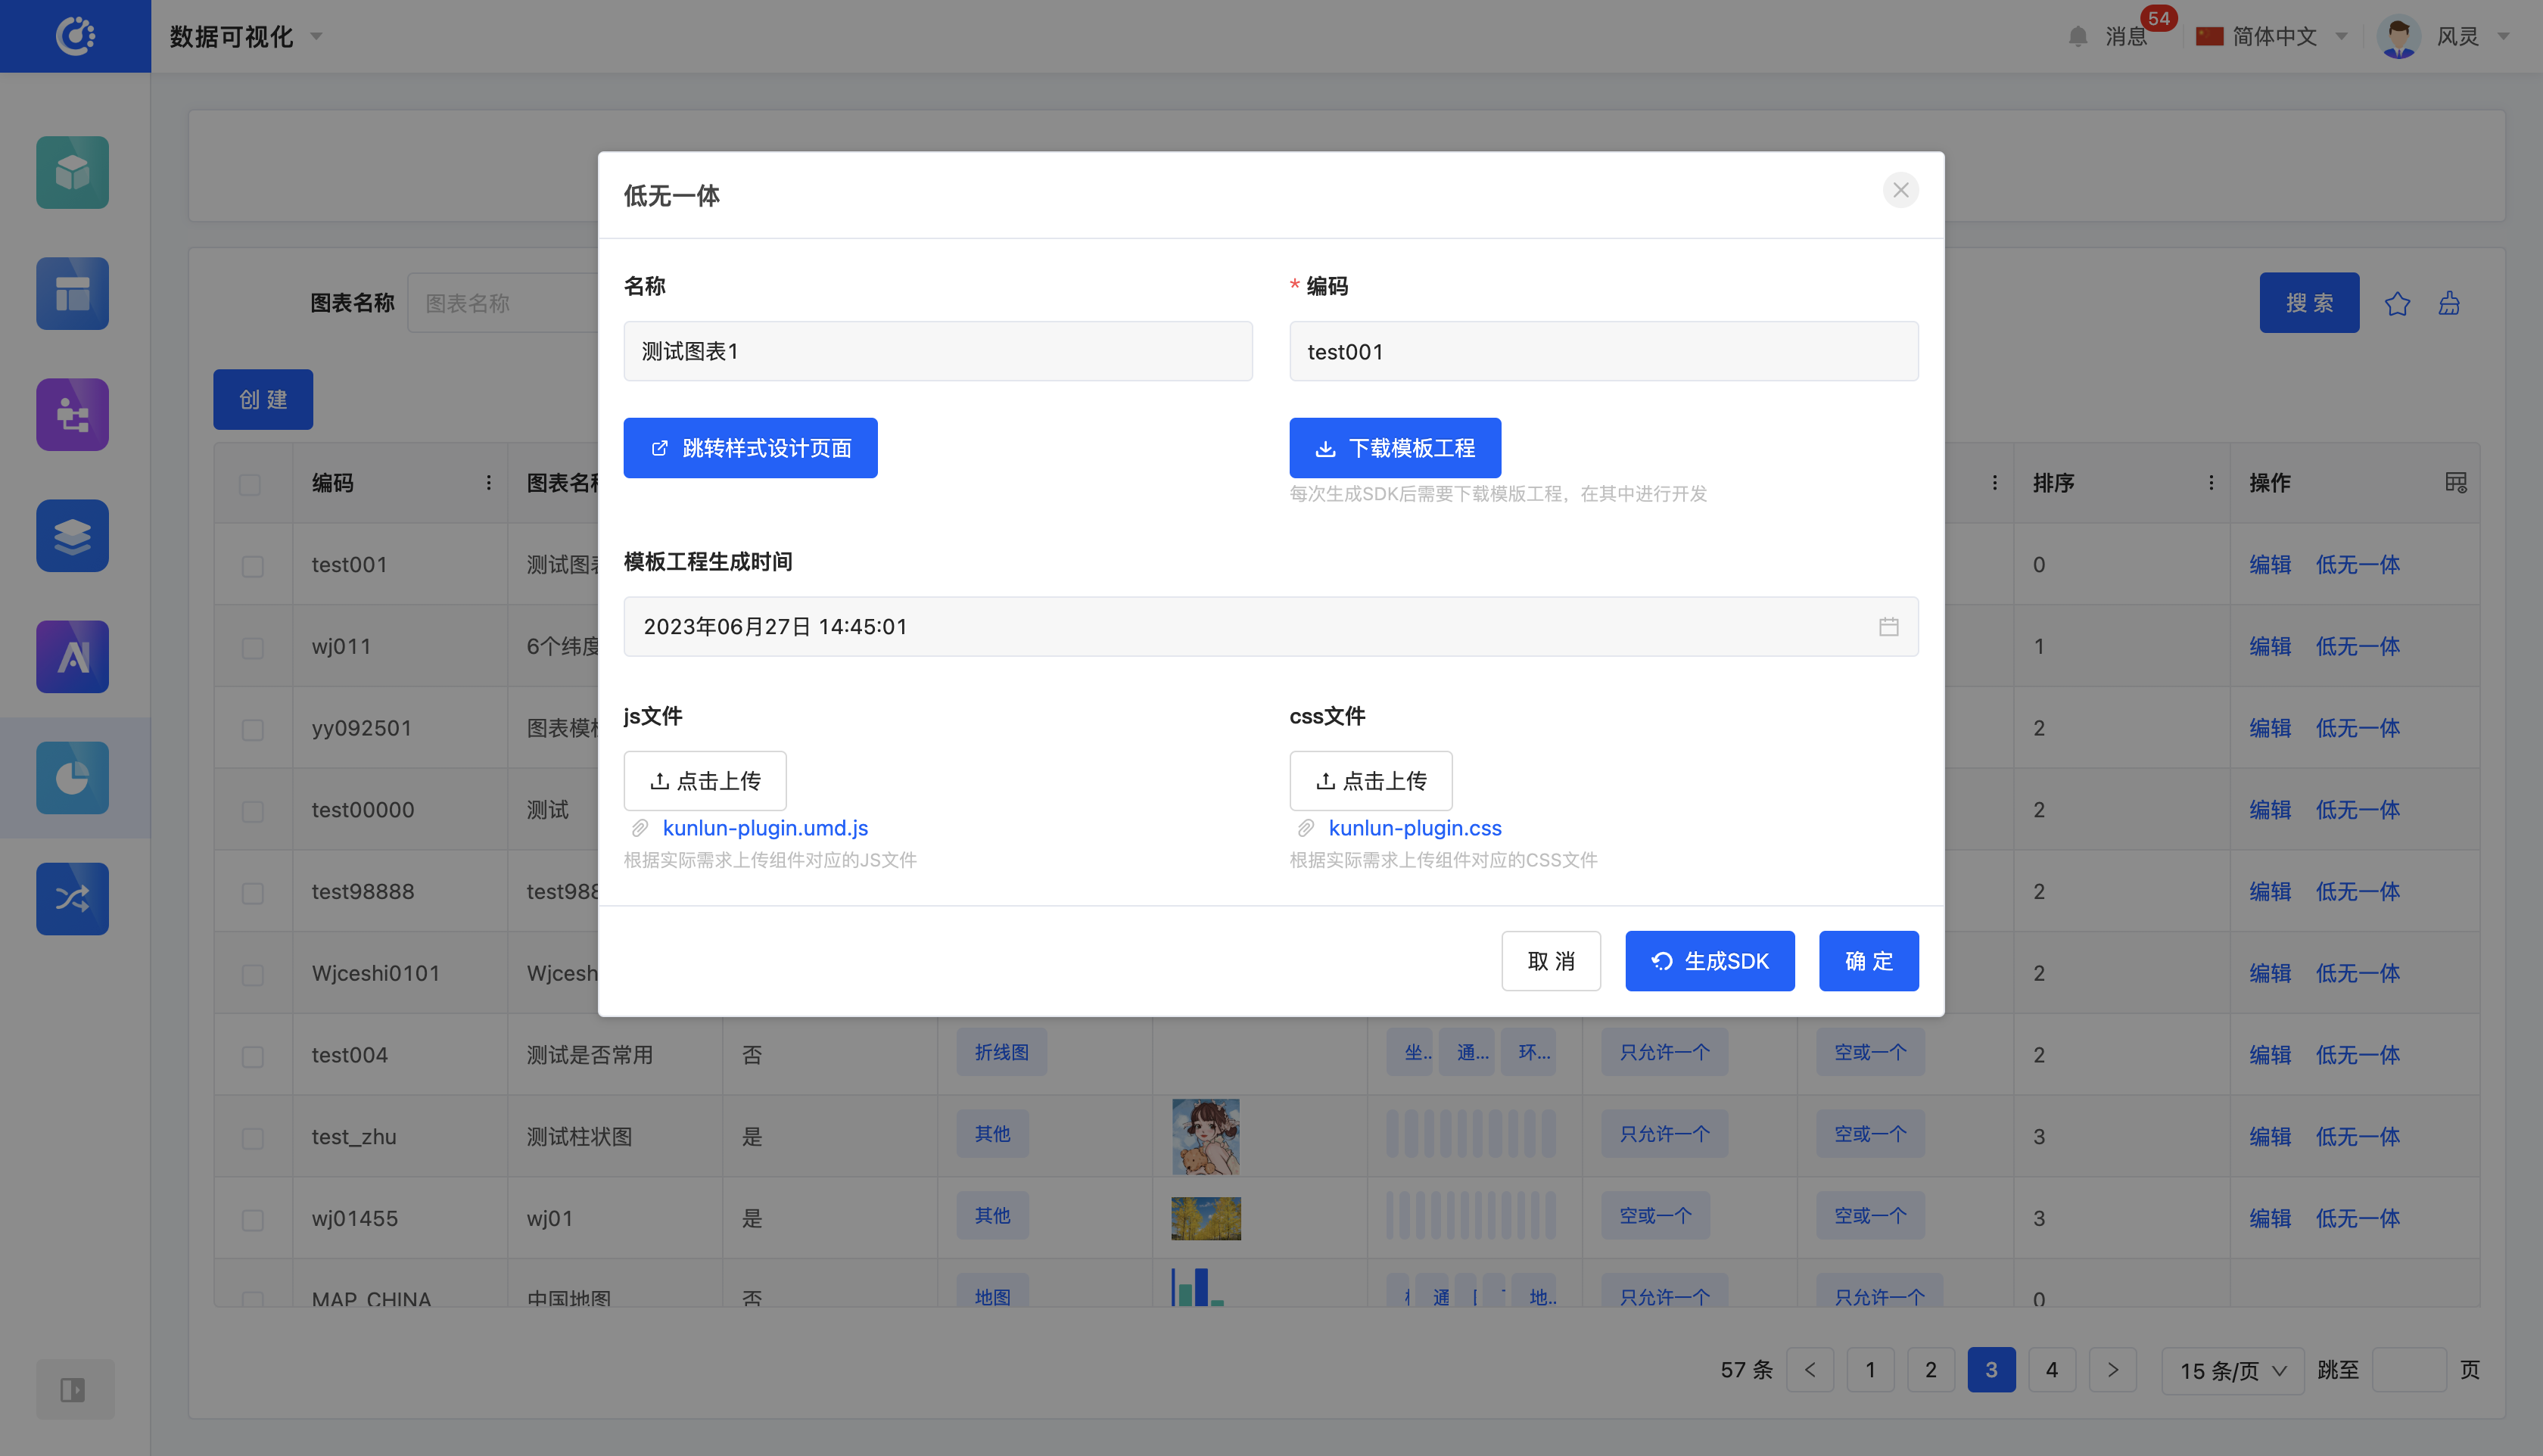
- Click "Low-Code and No-Code Integration" to display a pop-up window.
- If you are entering the chart template for the first time or the template style has changed, click "Generate SDK" to generate the corresponding SDK.
- After generating the SDK each time, click "Download Template Project" to download the corresponding template project and develop in it.
- Click "Upload JS File" or "Upload CSS File" to upload the developed files.
V. Design the Style of a Chart Template
1. Function Introduction
You can customize the style bar for an already created chart template and adjust it according to actual needs to meet personalized display requirements.
Tip
For the design of the style bar, you can refer to the "Custom Component - Element Design" documentation. In addition, the system provides various components related to chart styles to better customize chart styles.
2. Operation Method
Click "Low-Code and No-Code Integration" - "Go to Style Design Page" to navigate to the interface designer to design the style of the chart template.