Reports can aggregate various types of charts into a single entity, providing a comprehensive and intuitive platform for data presentation and analysis. Through reports, chart data from different types and sources, including bar charts, line charts, pie charts, scatter plots, and other forms, can be integrated and presented in a unified interface.
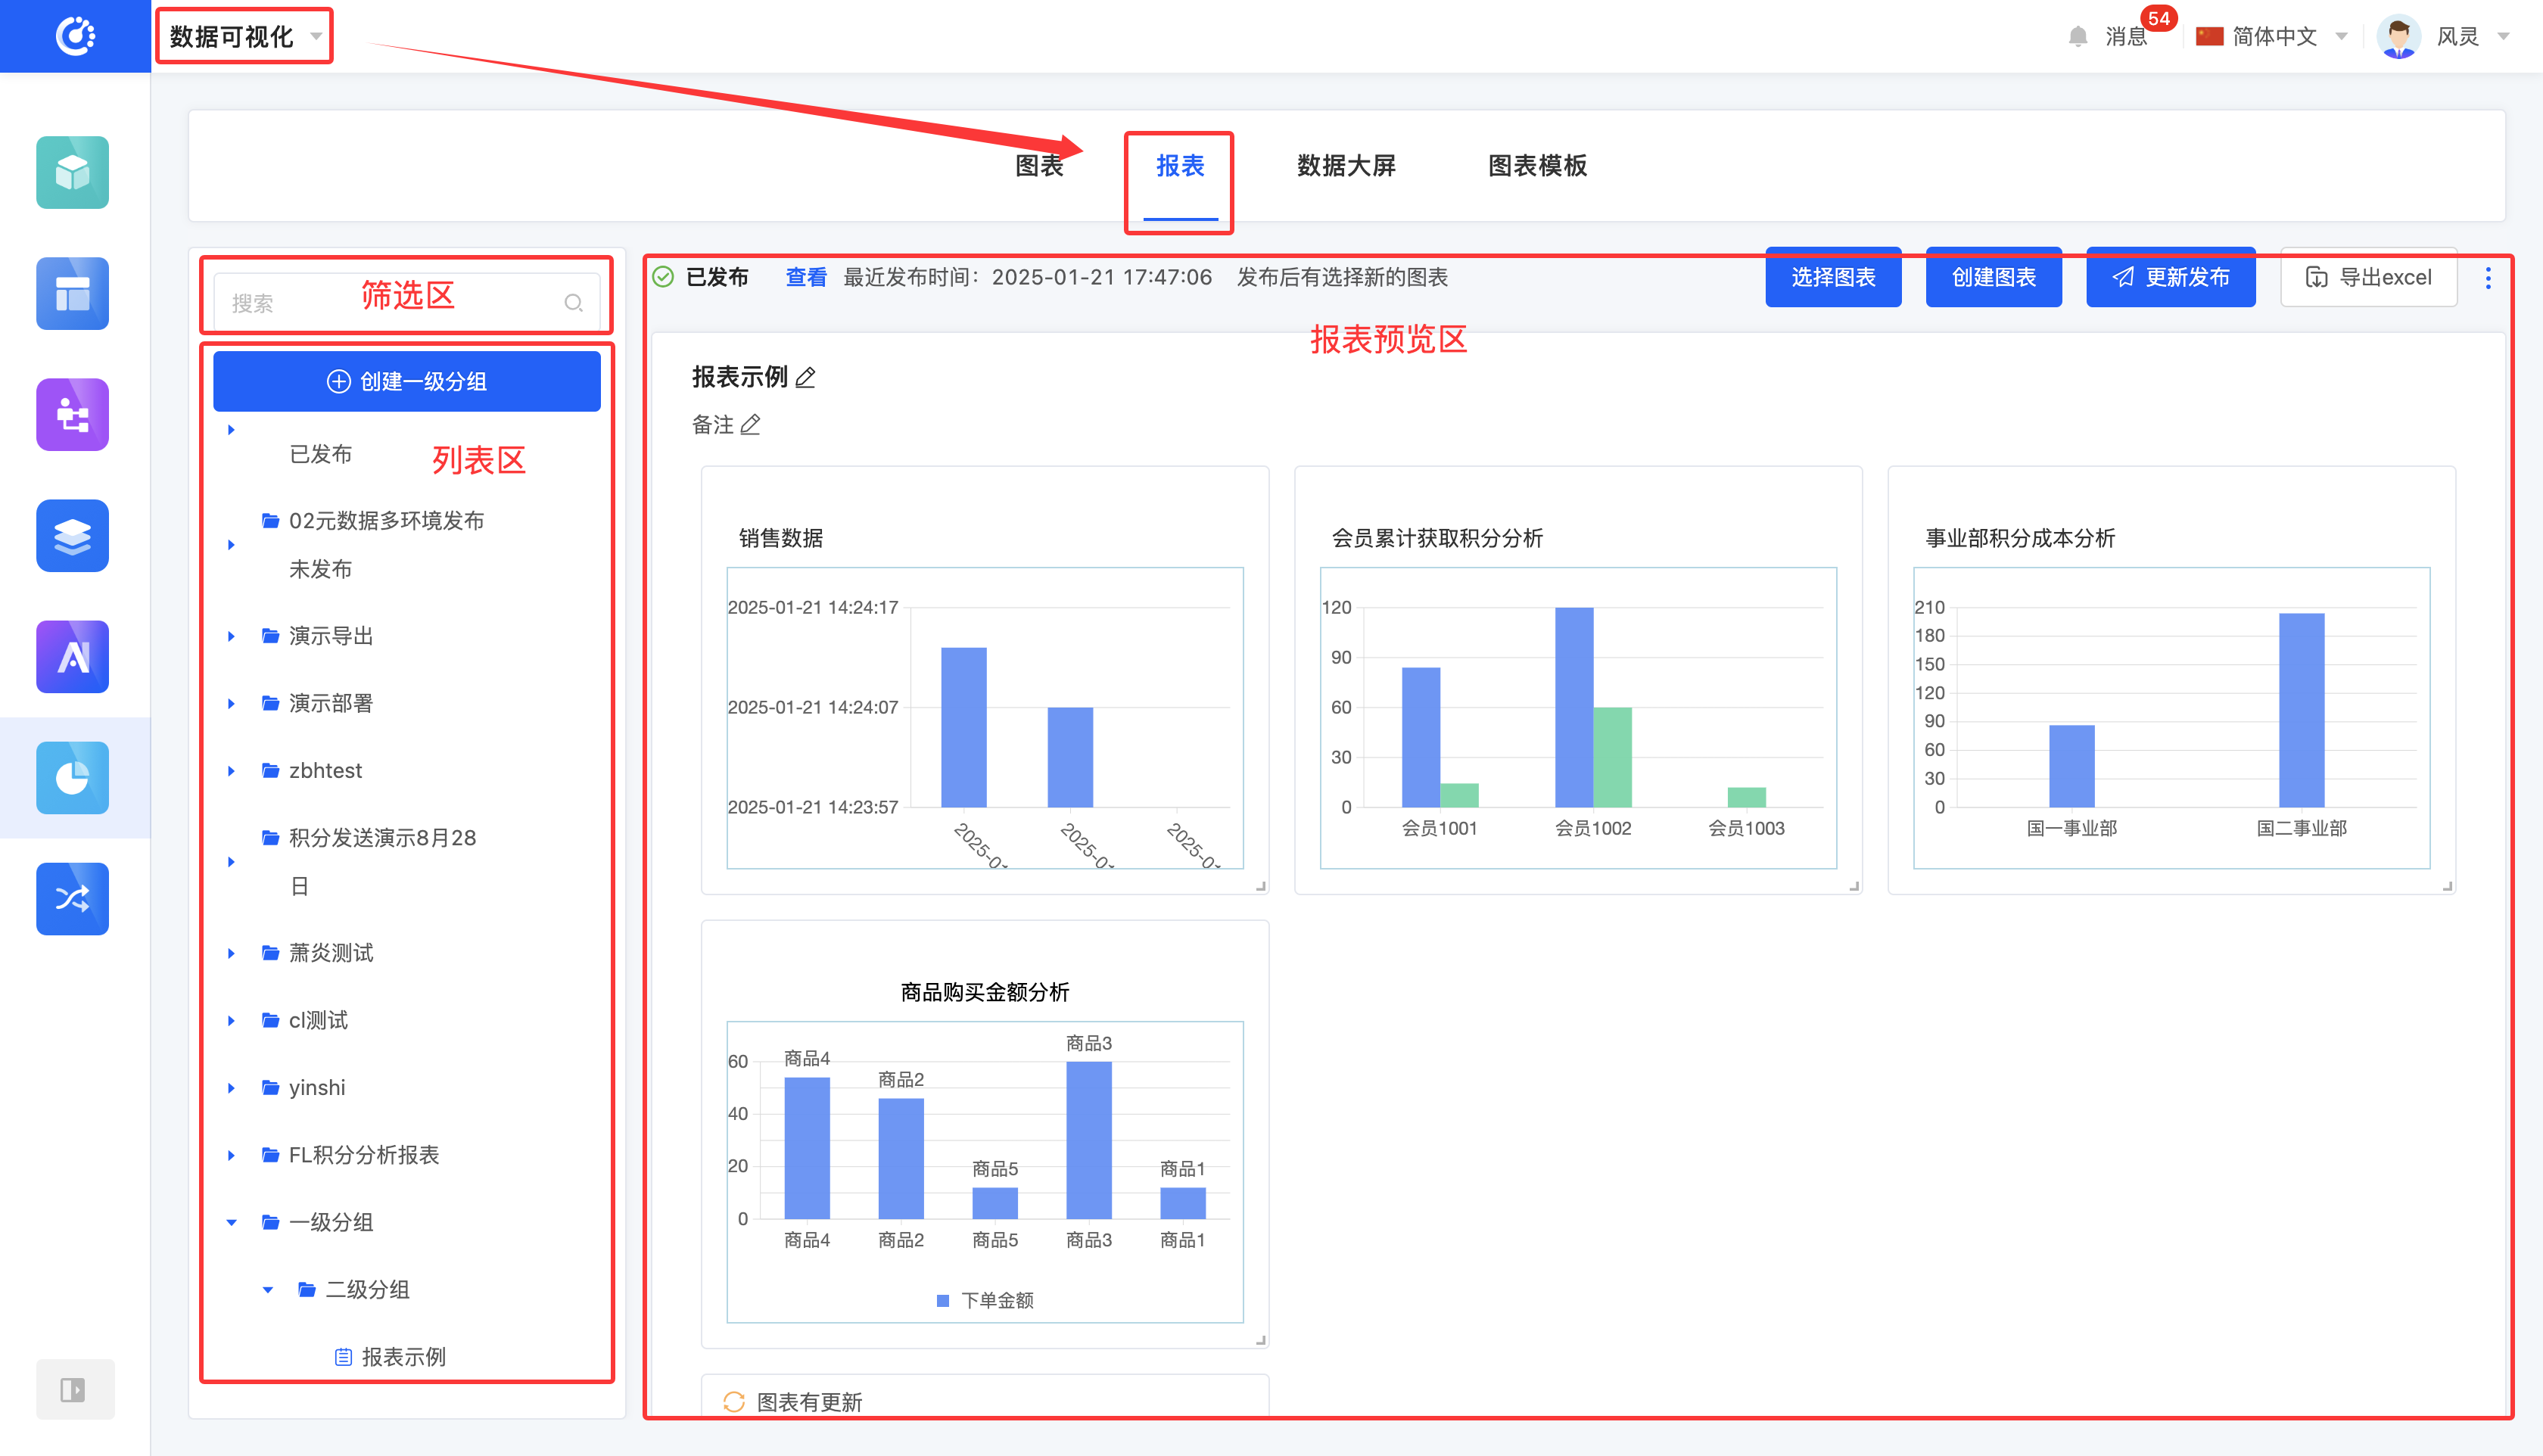
Upon entering the "Reports" page in the data visualization section, you can manage reports. This page mainly consists of three parts: the filtering area, the list area, and the report preview area.
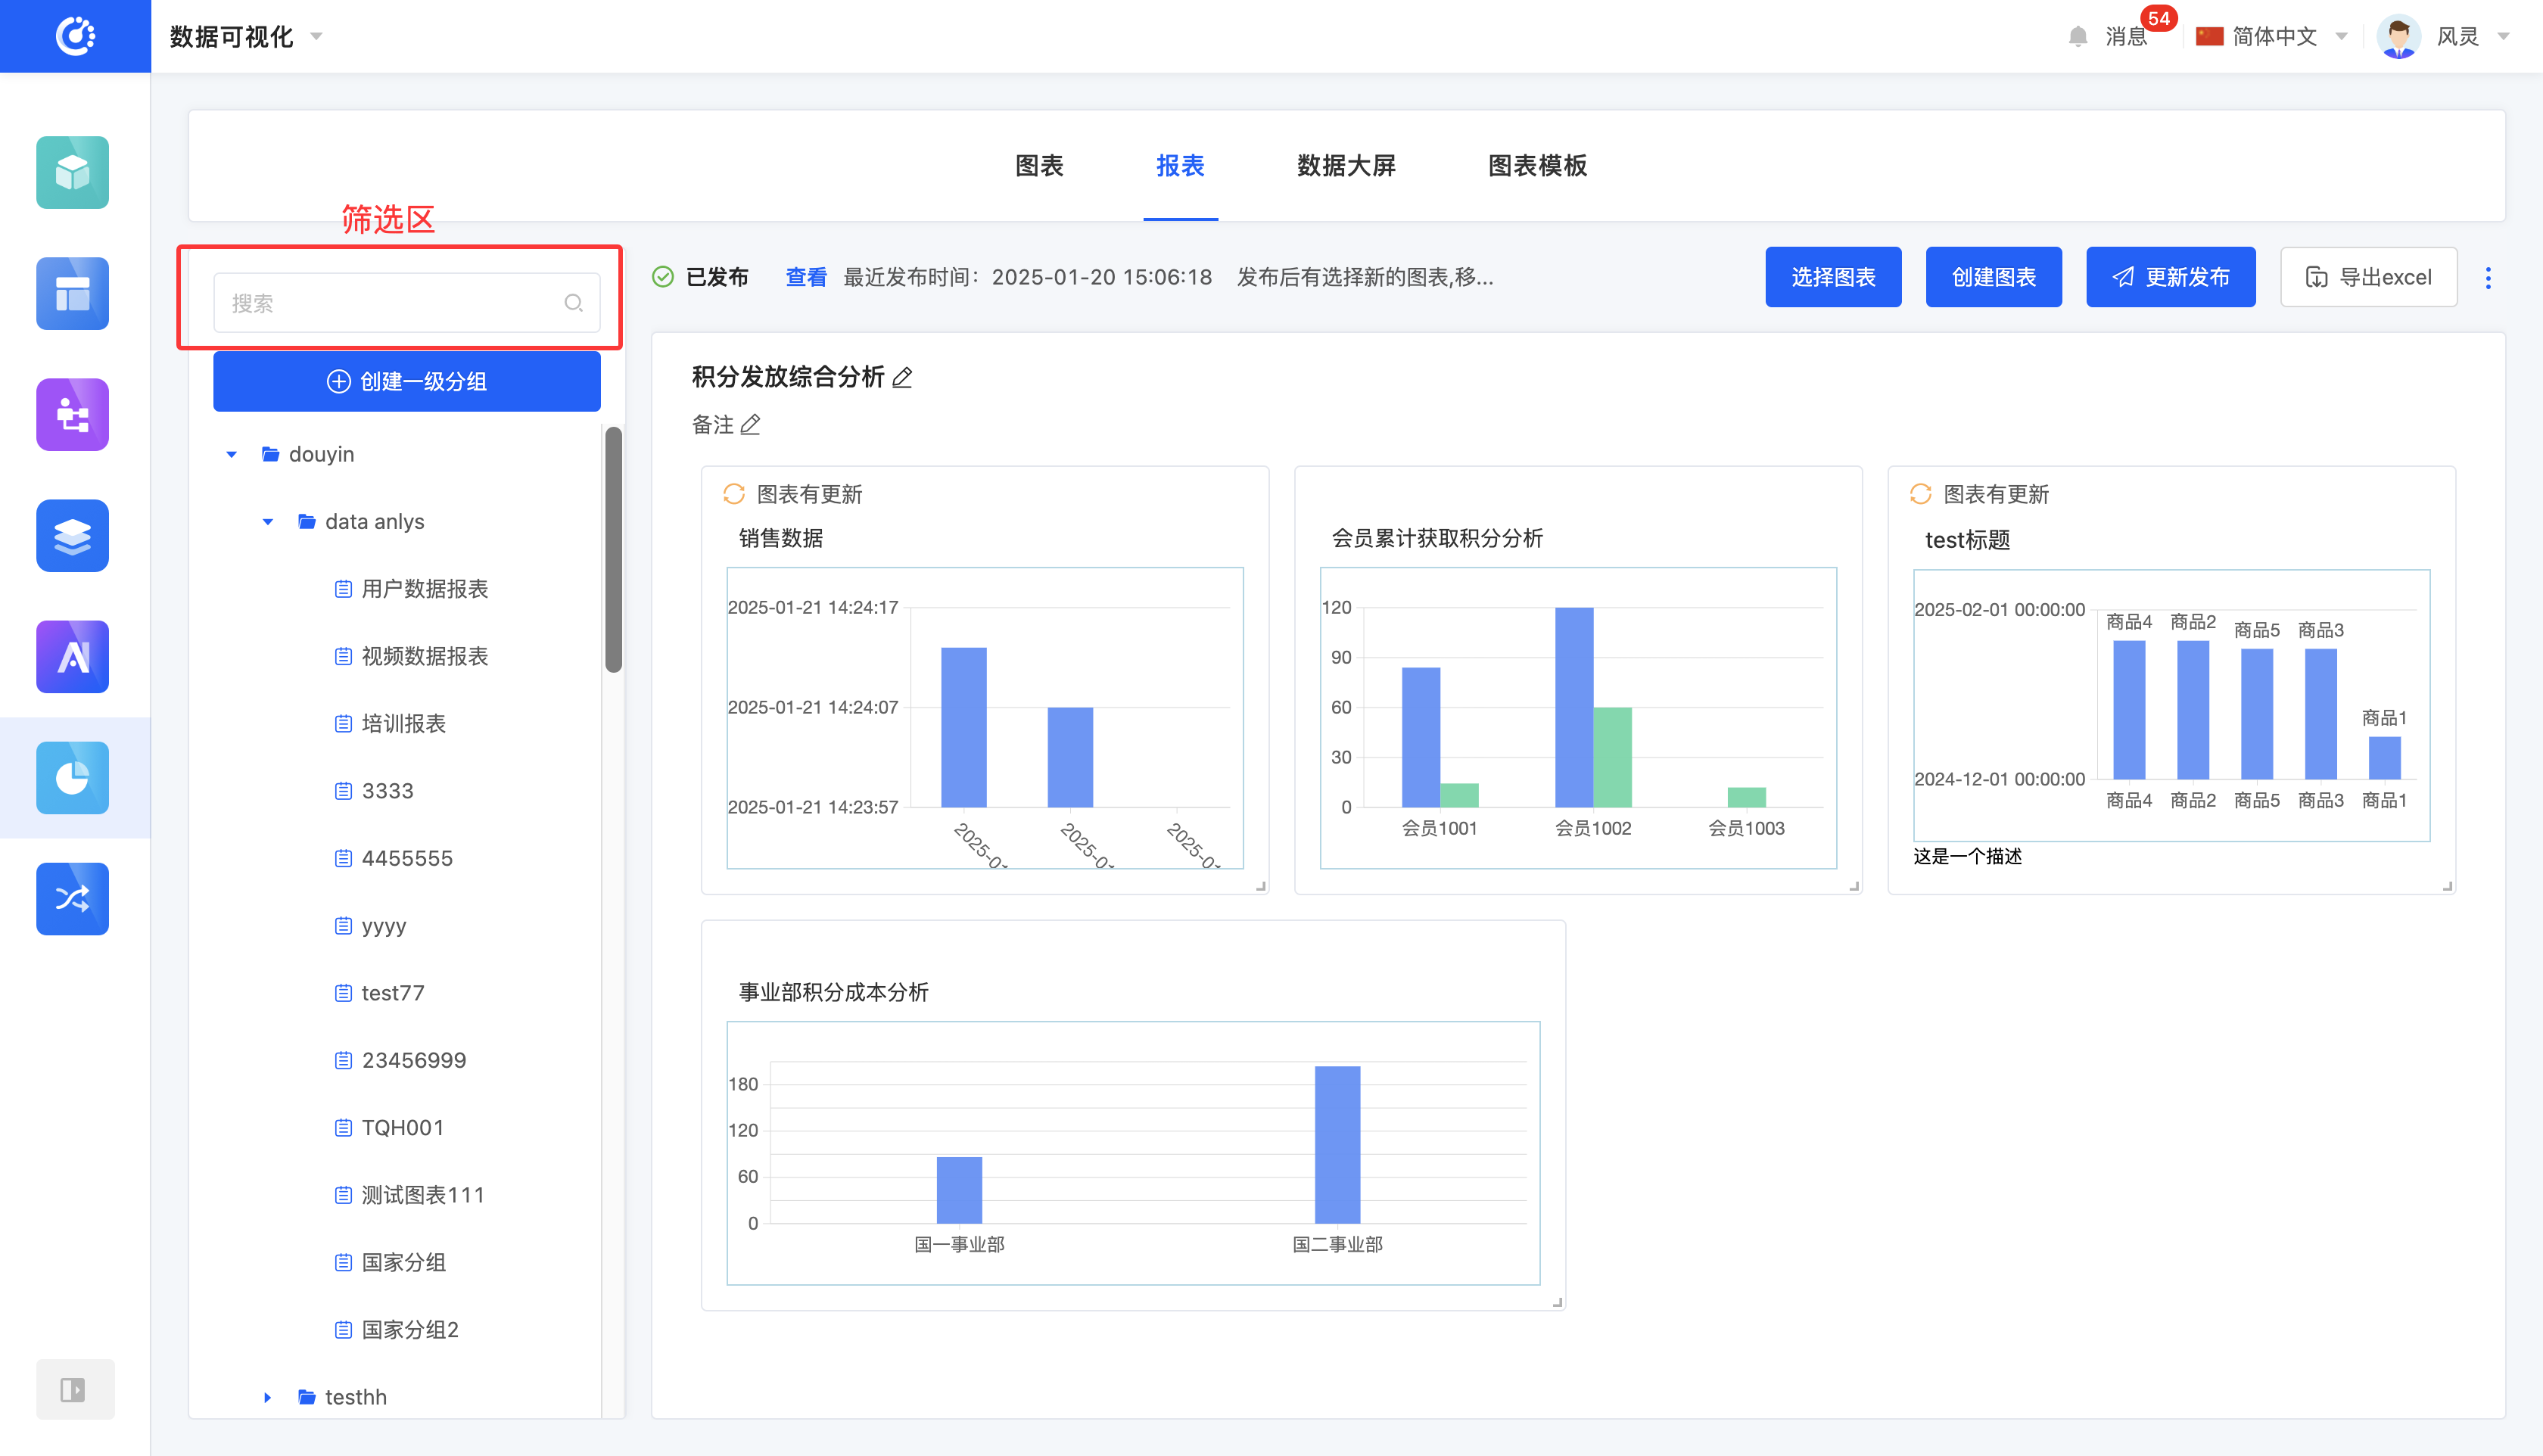
- Filtering Area: Provides a report filtering function, facilitating users to quickly find the required report items.
- List Area: Displays a list of reports and their groups, clearly presenting the report structure.
- Report Preview Area: Displays the designed reports. Users can select charts, publish, export, and perform other operations here.
I. Filtering
1. Function Introduction
According to actual business requirements, you can customize report filtering conditions. After entering the report or group name, the system can precisely filter the required items for subsequent operations.
2. Operation Method
Enter the conditions in the filtering area to filter reports or groups.
II. Group Management
1. Function Introduction
The grouping function can be used to categorize charts.
2. Operation Method
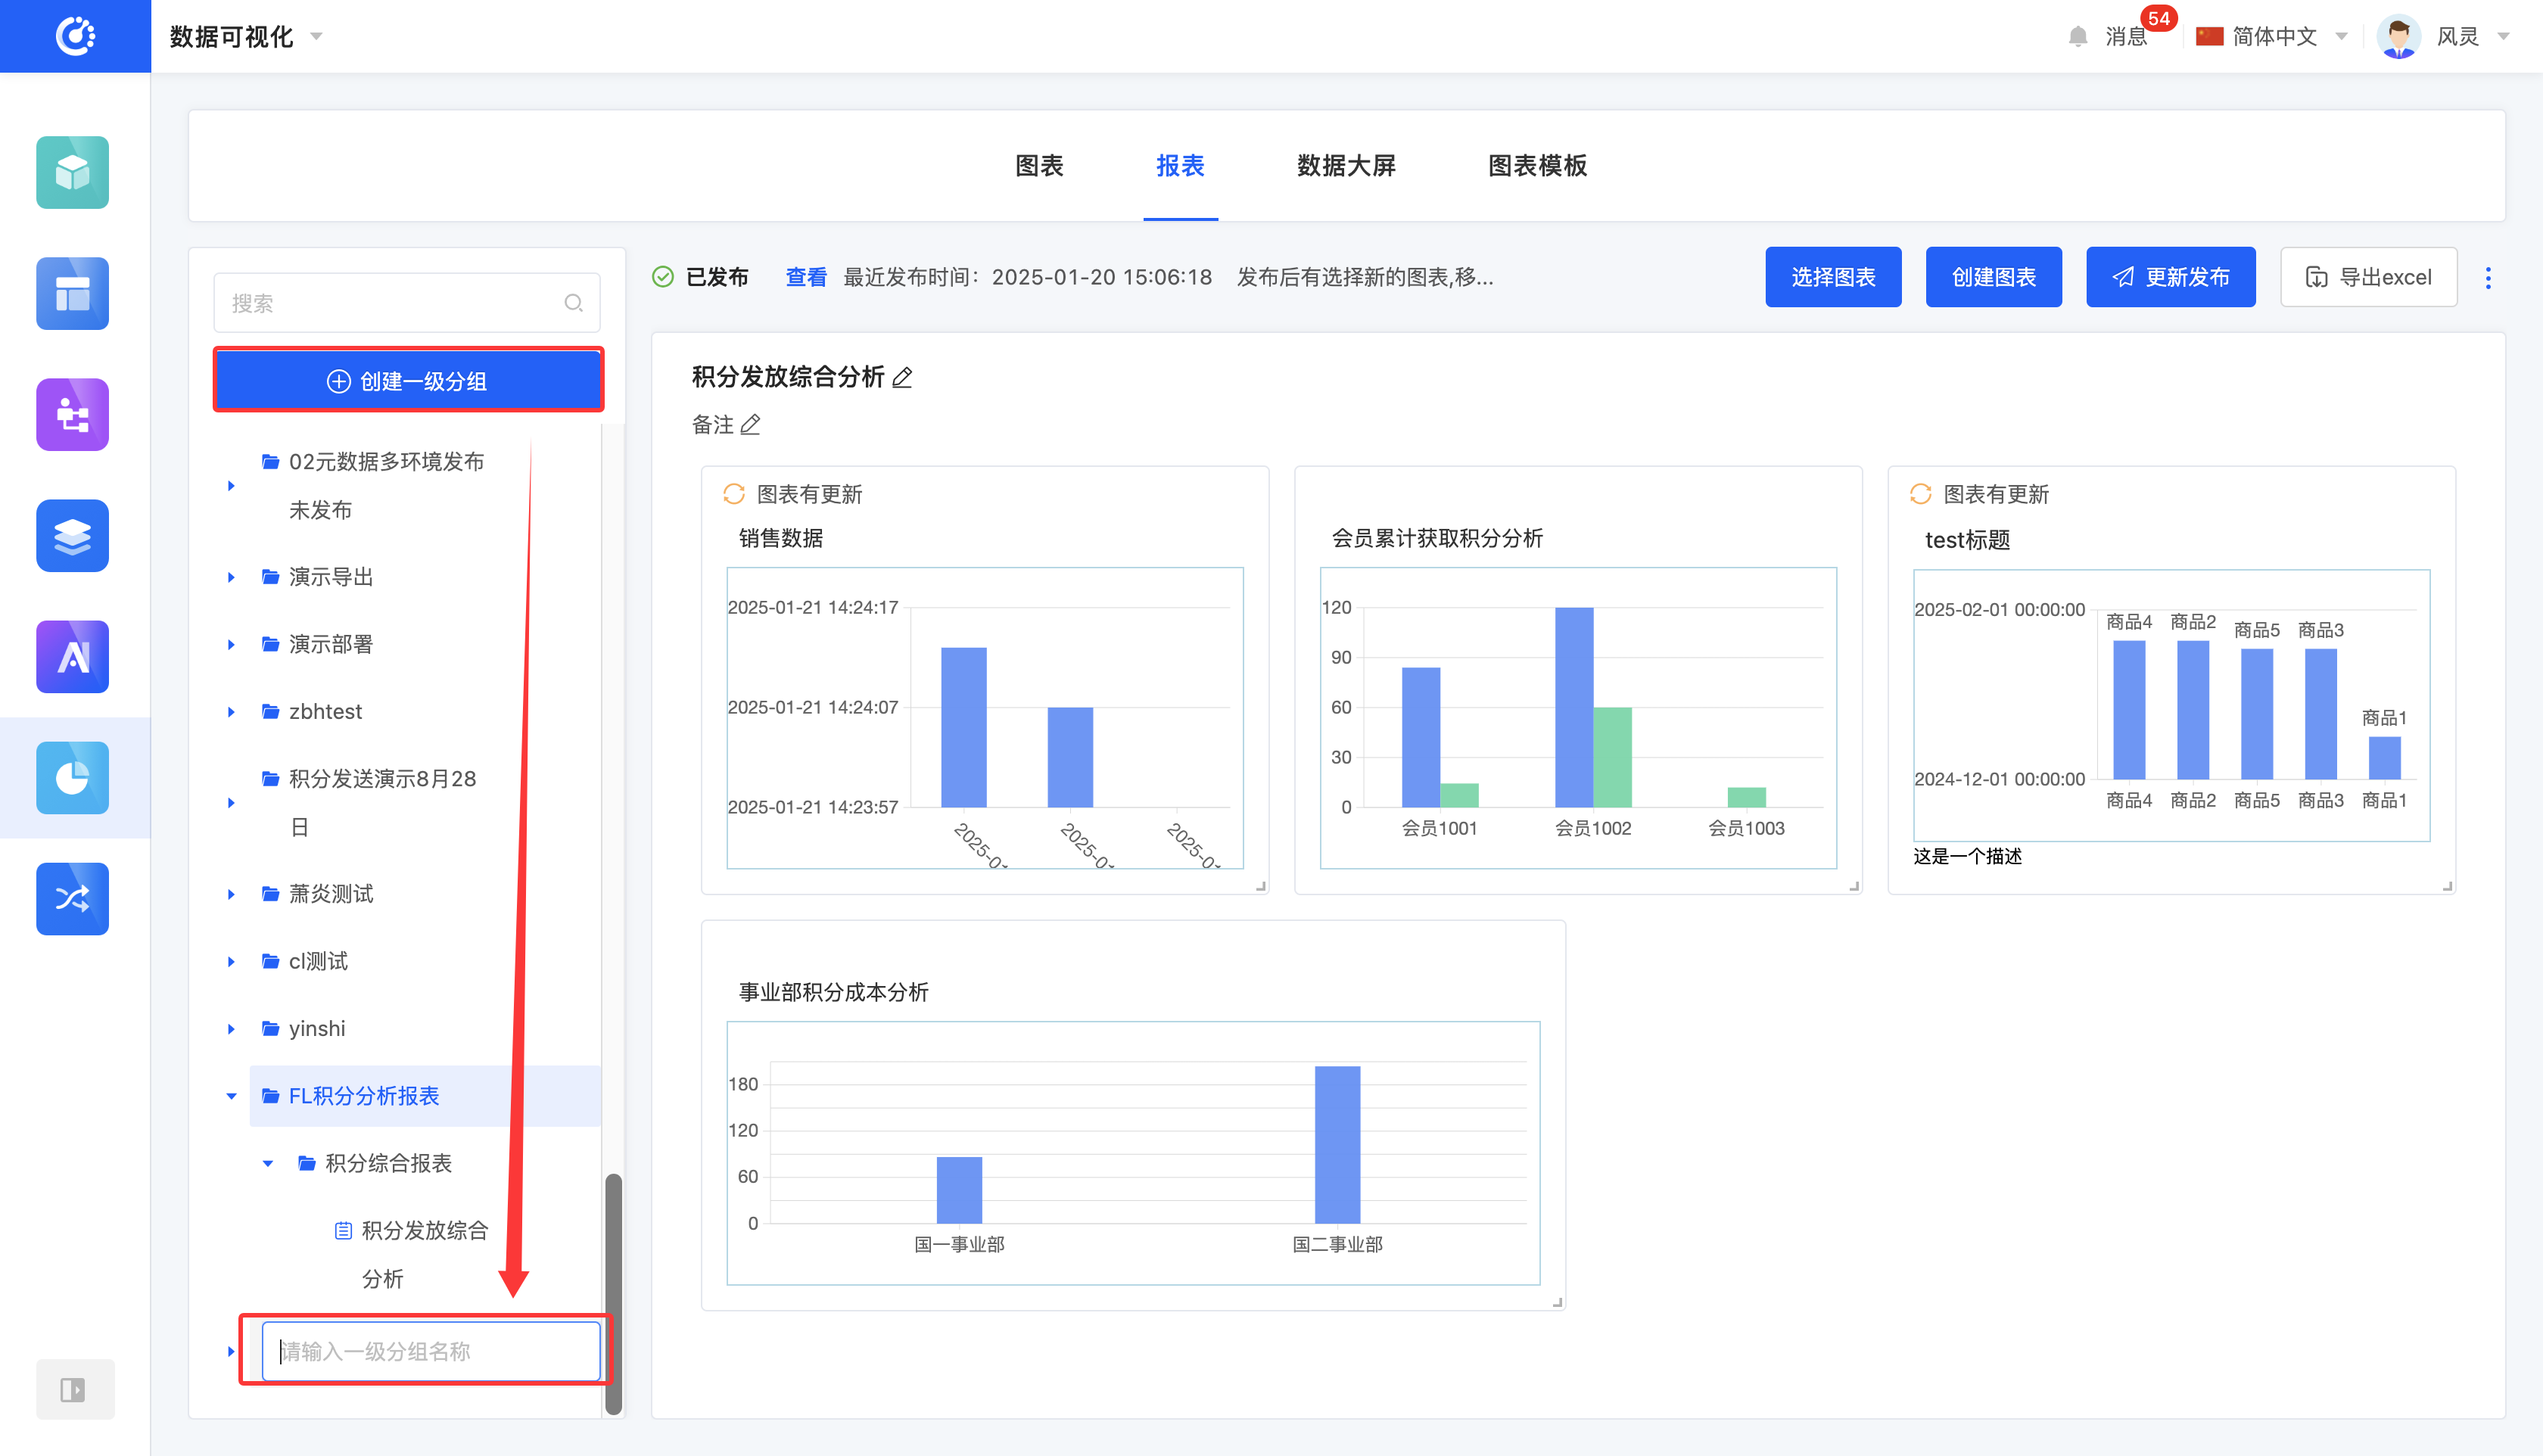
- Create a Group: First, click the "Create First-Level Group" button and enter the first-level group name to complete the creation of the first-level group. Then, below the first-level group, click the "Create" icon and enter the second-level group name to successfully create the second-level group. At this point, the group creation is complete.
Note
- First-level group names are not allowed to be repeated. First-level group names and second-level group names are not allowed to be repeated.
- Second-level group names under the same first-level group are not allowed to be repeated.
- Second-level group names under different first-level groups are allowed to be repeated.

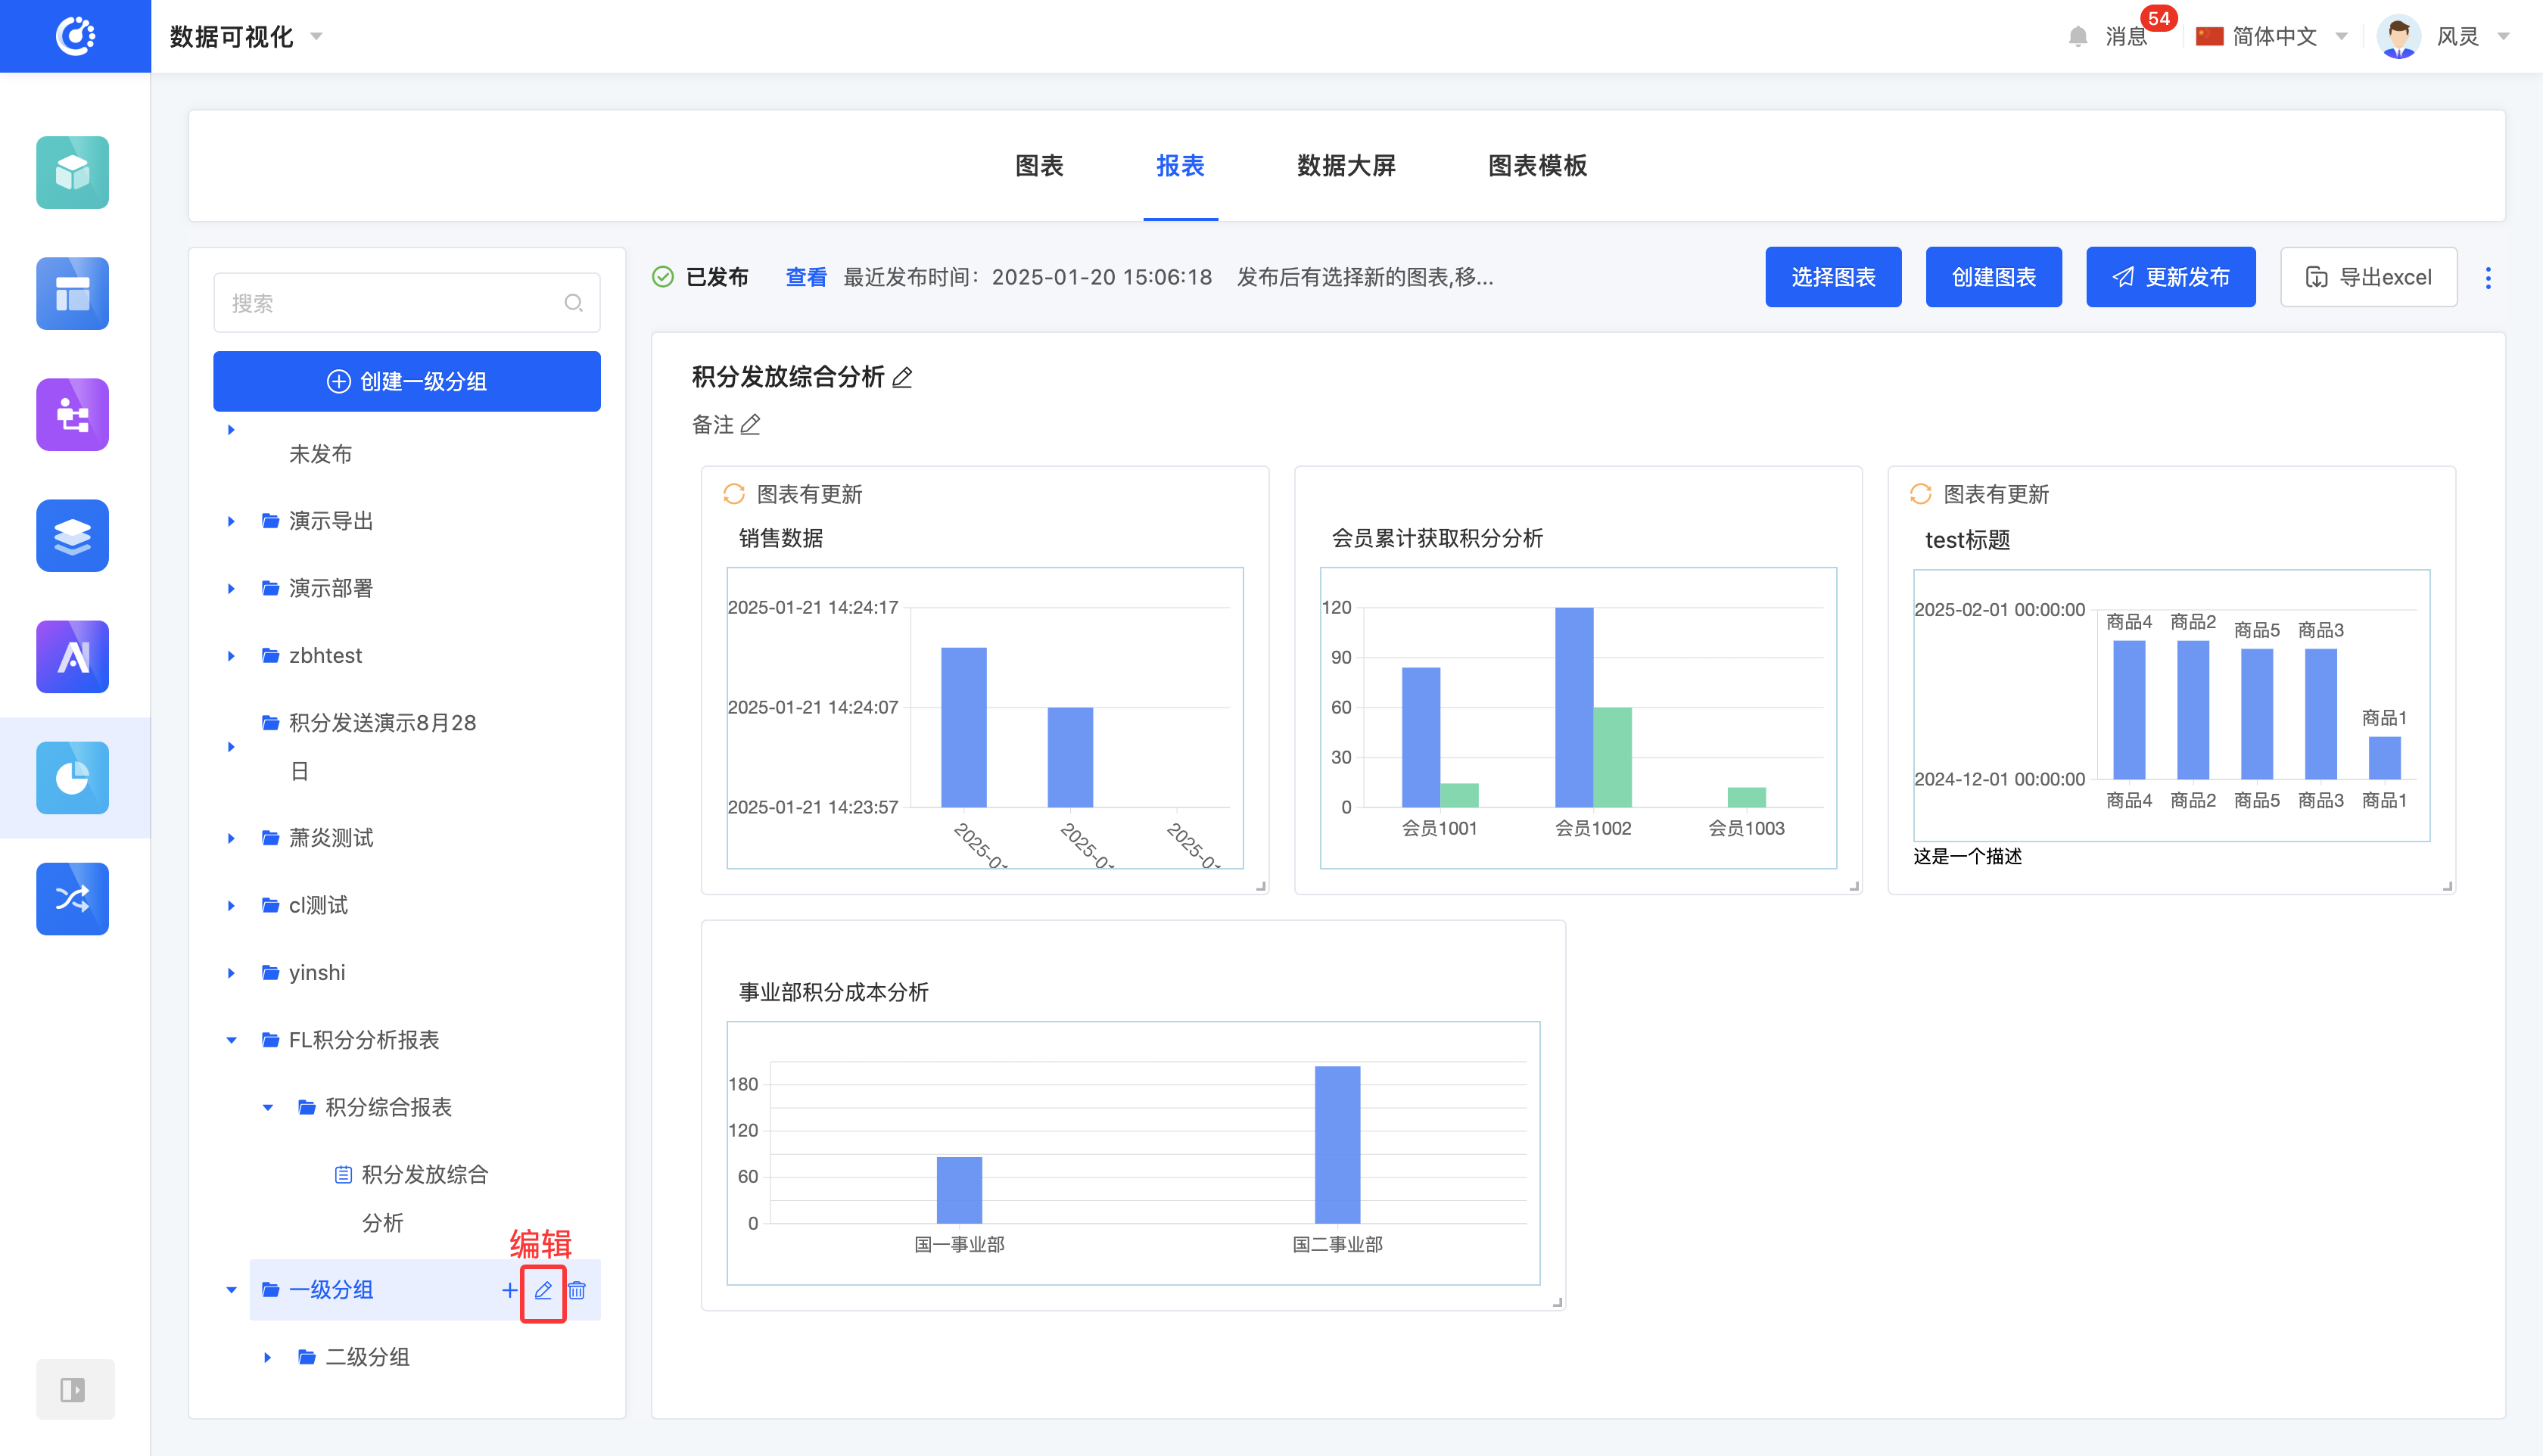
- Edit Group Name: Move the mouse over the group to be modified, click the "Edit" icon, and then you can modify the group name.
- Modify Group Position: Drag the group to change its position.
Note
- Only groups at the same level can be dragged. A first-level group cannot be changed to a second-level group, or vice versa. Similarly, a created report cannot be changed to a group.
- A second-level group can be moved under another first-level group.
- Delete Group: Move the mouse over the group to be deleted, click the "Delete" icon, and the group will be deleted.
Note
- When deleting a first-level group, the second-level groups it contains will also be deleted.
- If there are charts under the group, the group cannot be successfully deleted.

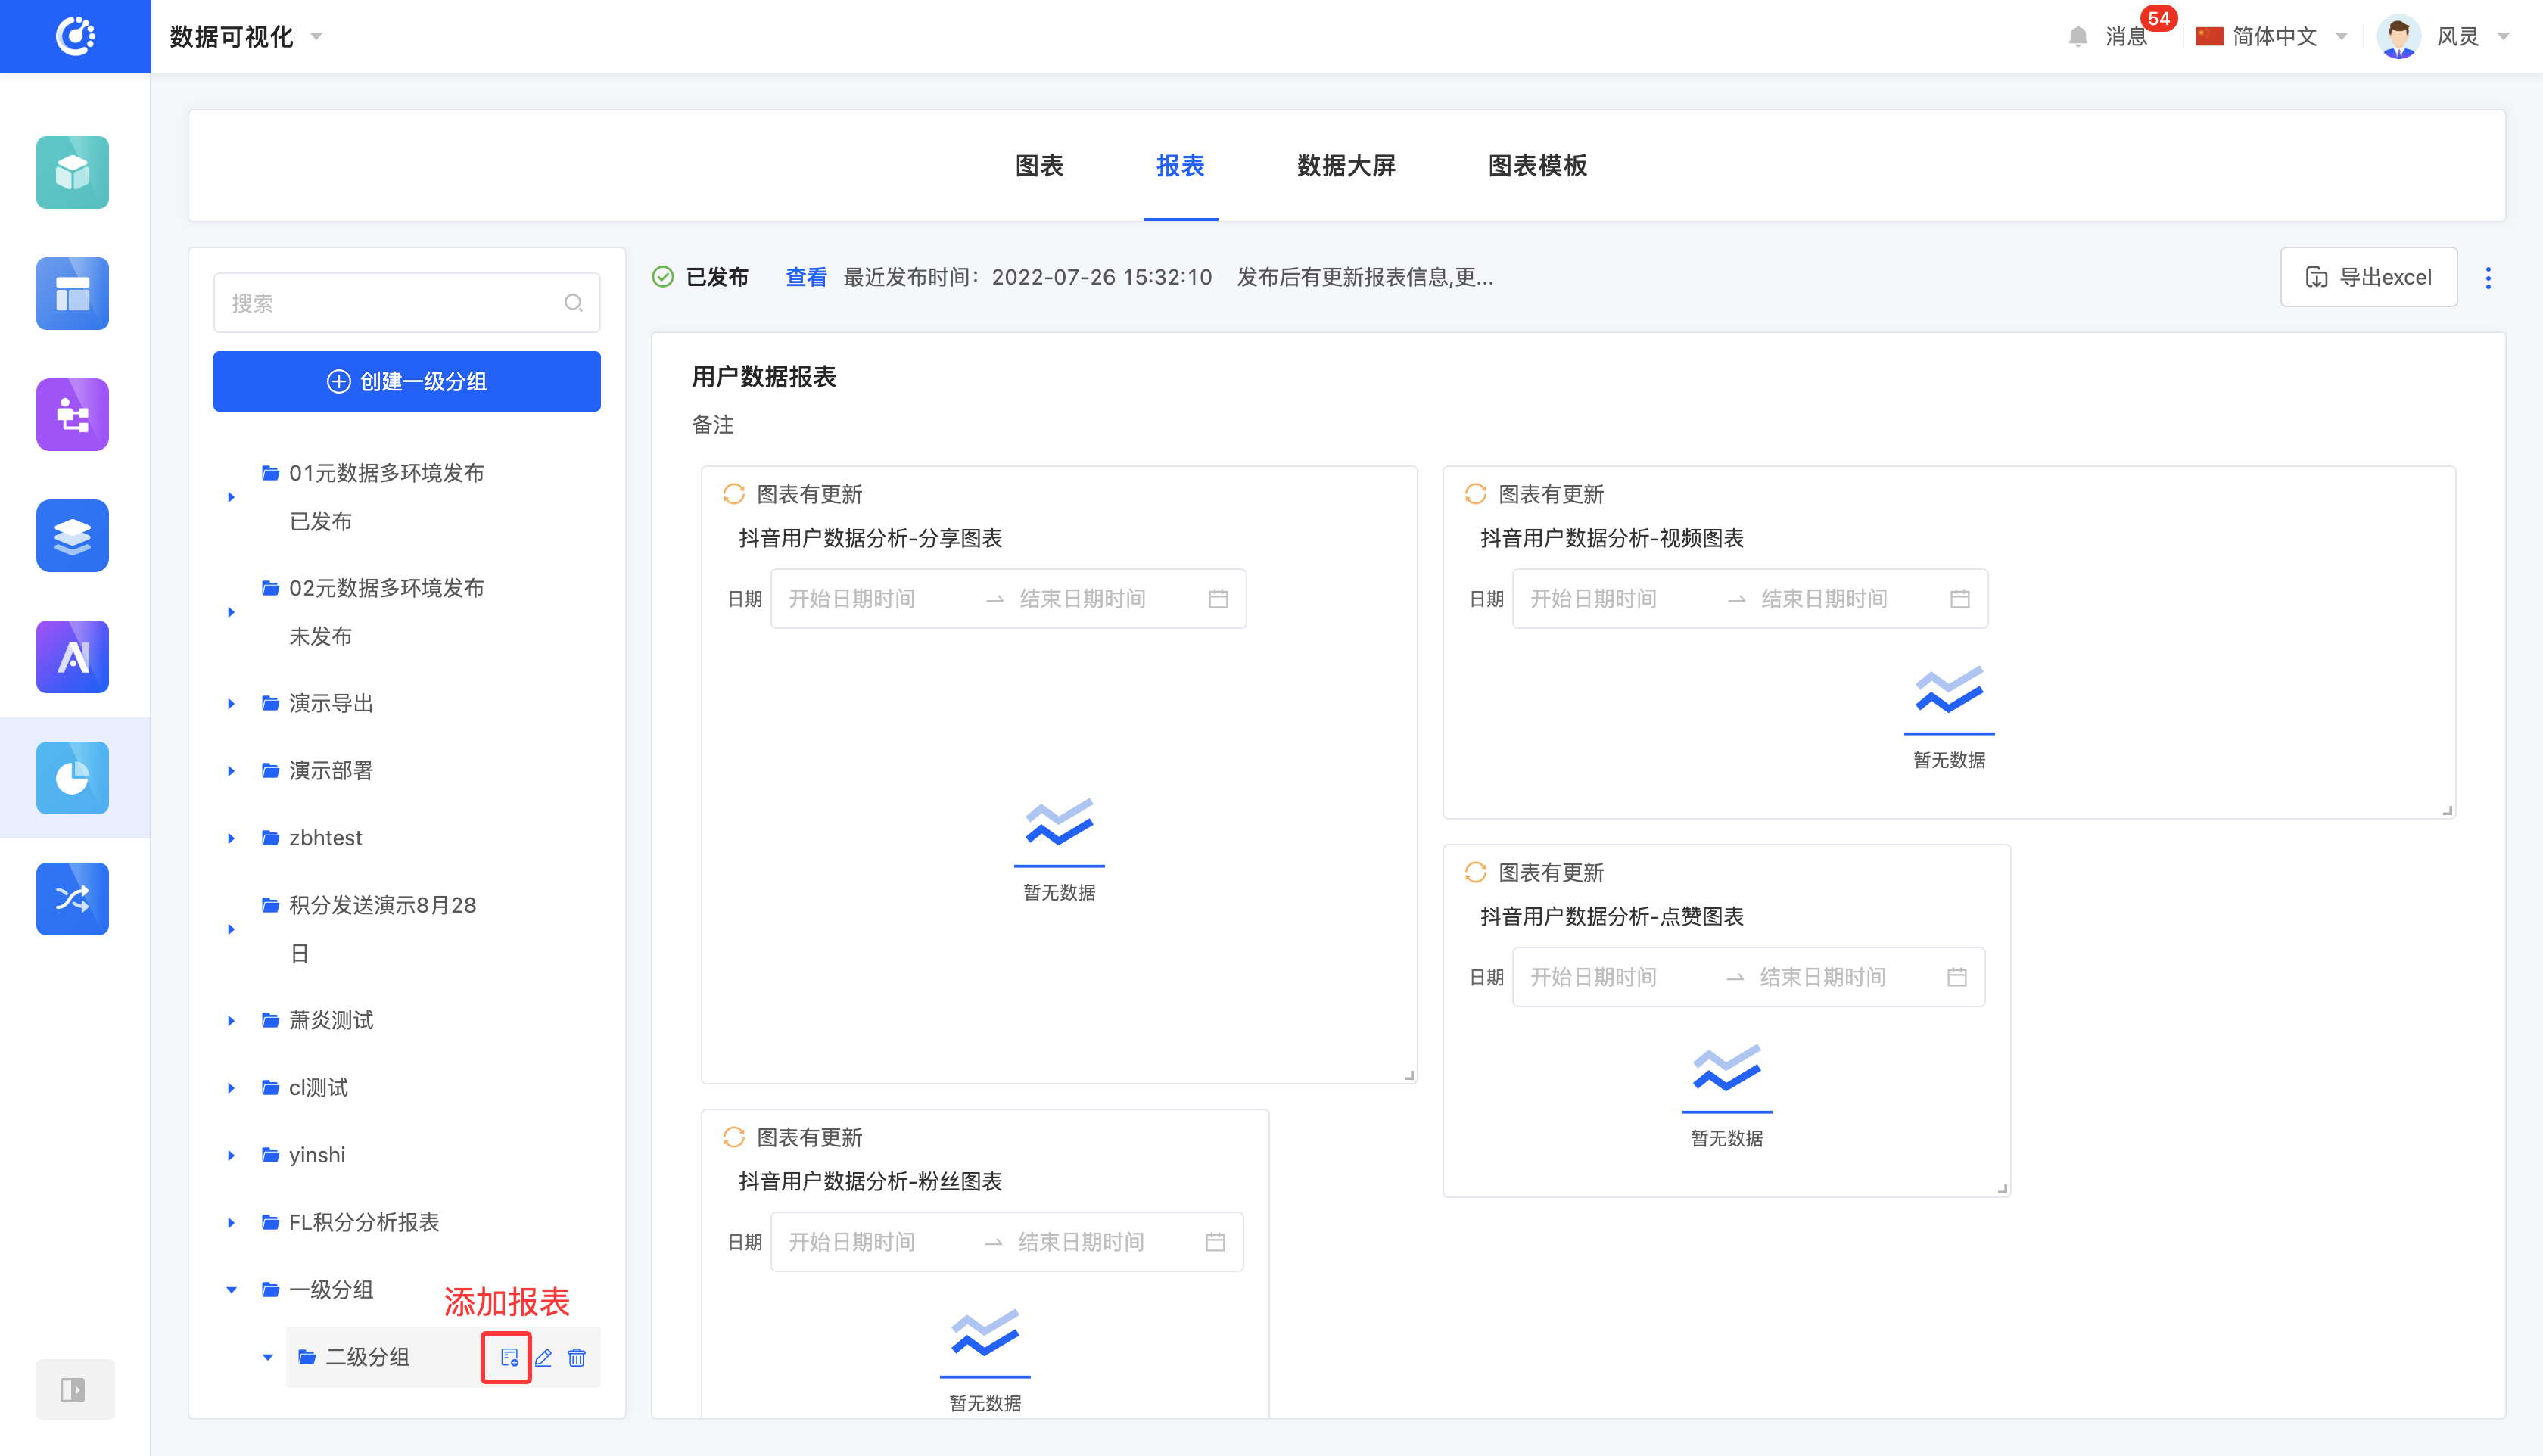
III. Add a Report
1. Function Introduction
You can add a report under a second-level group. During the addition process, you need to edit the report title.
Note
The title length must be at least 4 characters.
2. Operation Method
Click the "Add Report" icon under the second-level group in the list area, enter the title, and the report will be successfully created.
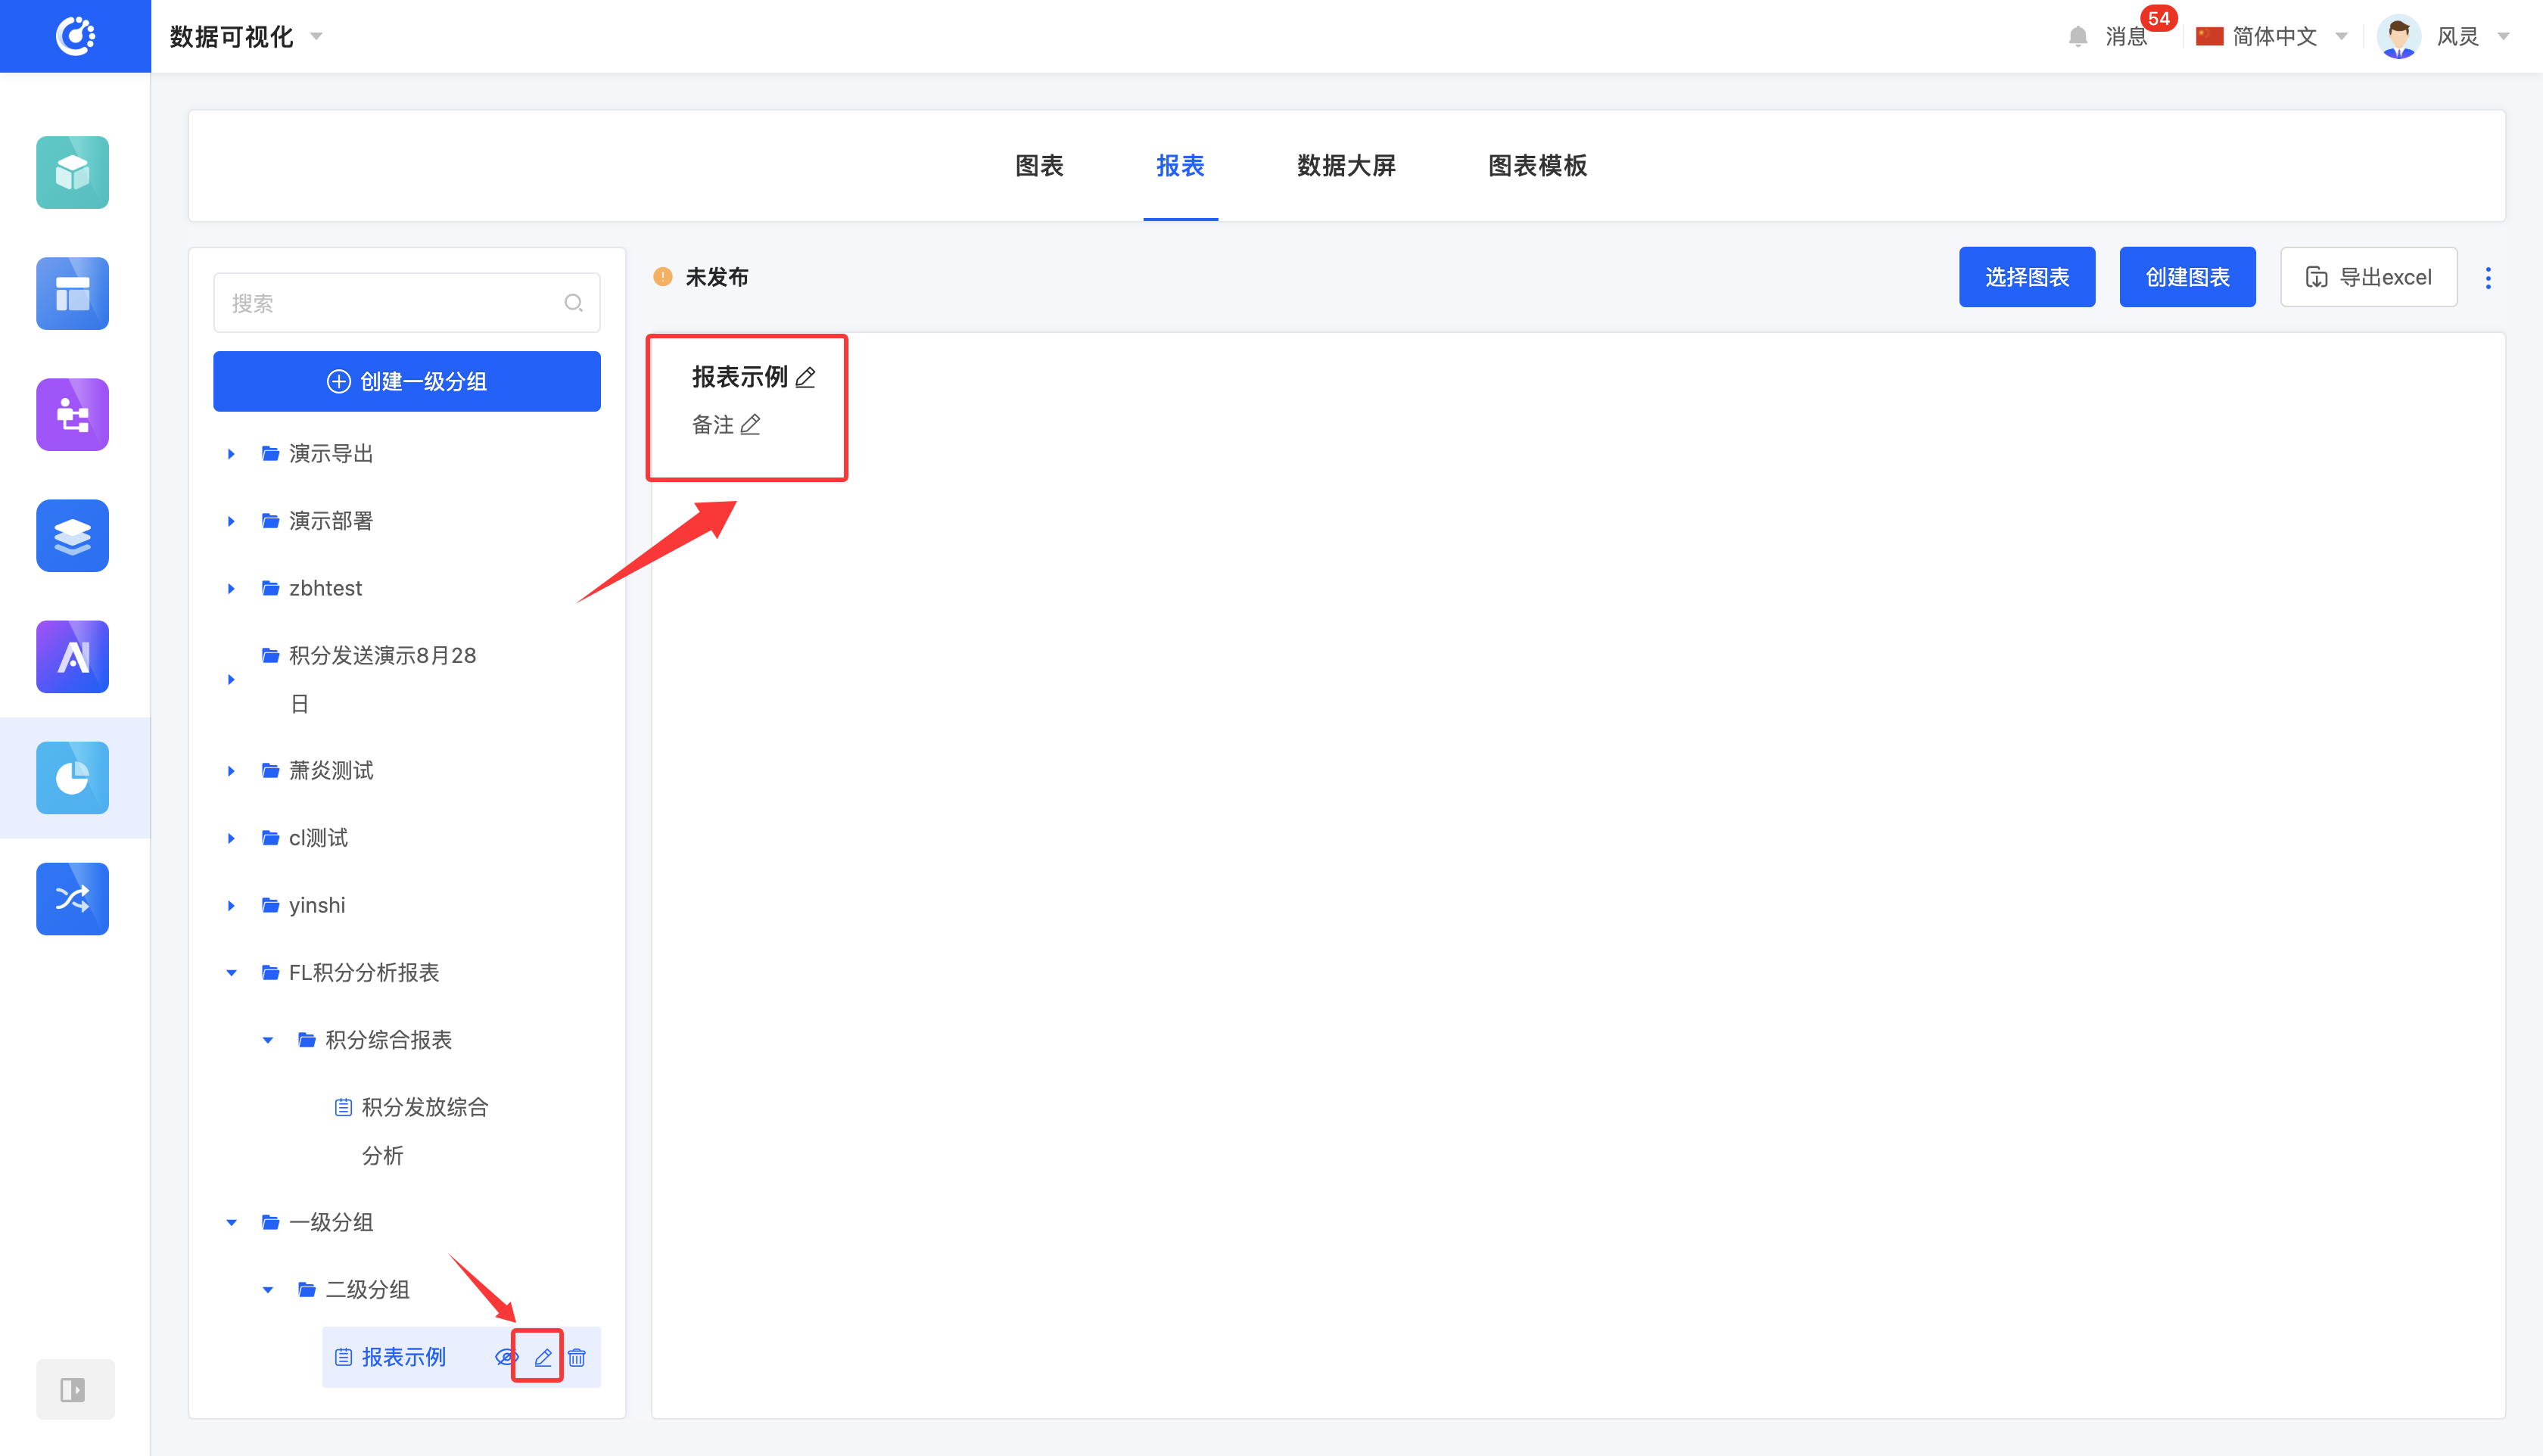
IV. Edit a Report
1. Function Introduction
Supports editing charts that are either unpublished or published but not hidden, providing three editing scenarios:
- Edit in the list area: You can only edit the title.
- Edit in the report preview area: You can edit the title and the note.
2. Operation Method
- In the list area, select the report, click the "Edit" icon, enter the information, and the report will be successfully edited.
- In the report preview area, click the title area, the note area, or the "Edit" icon, enter the information, and the report will be successfully edited.
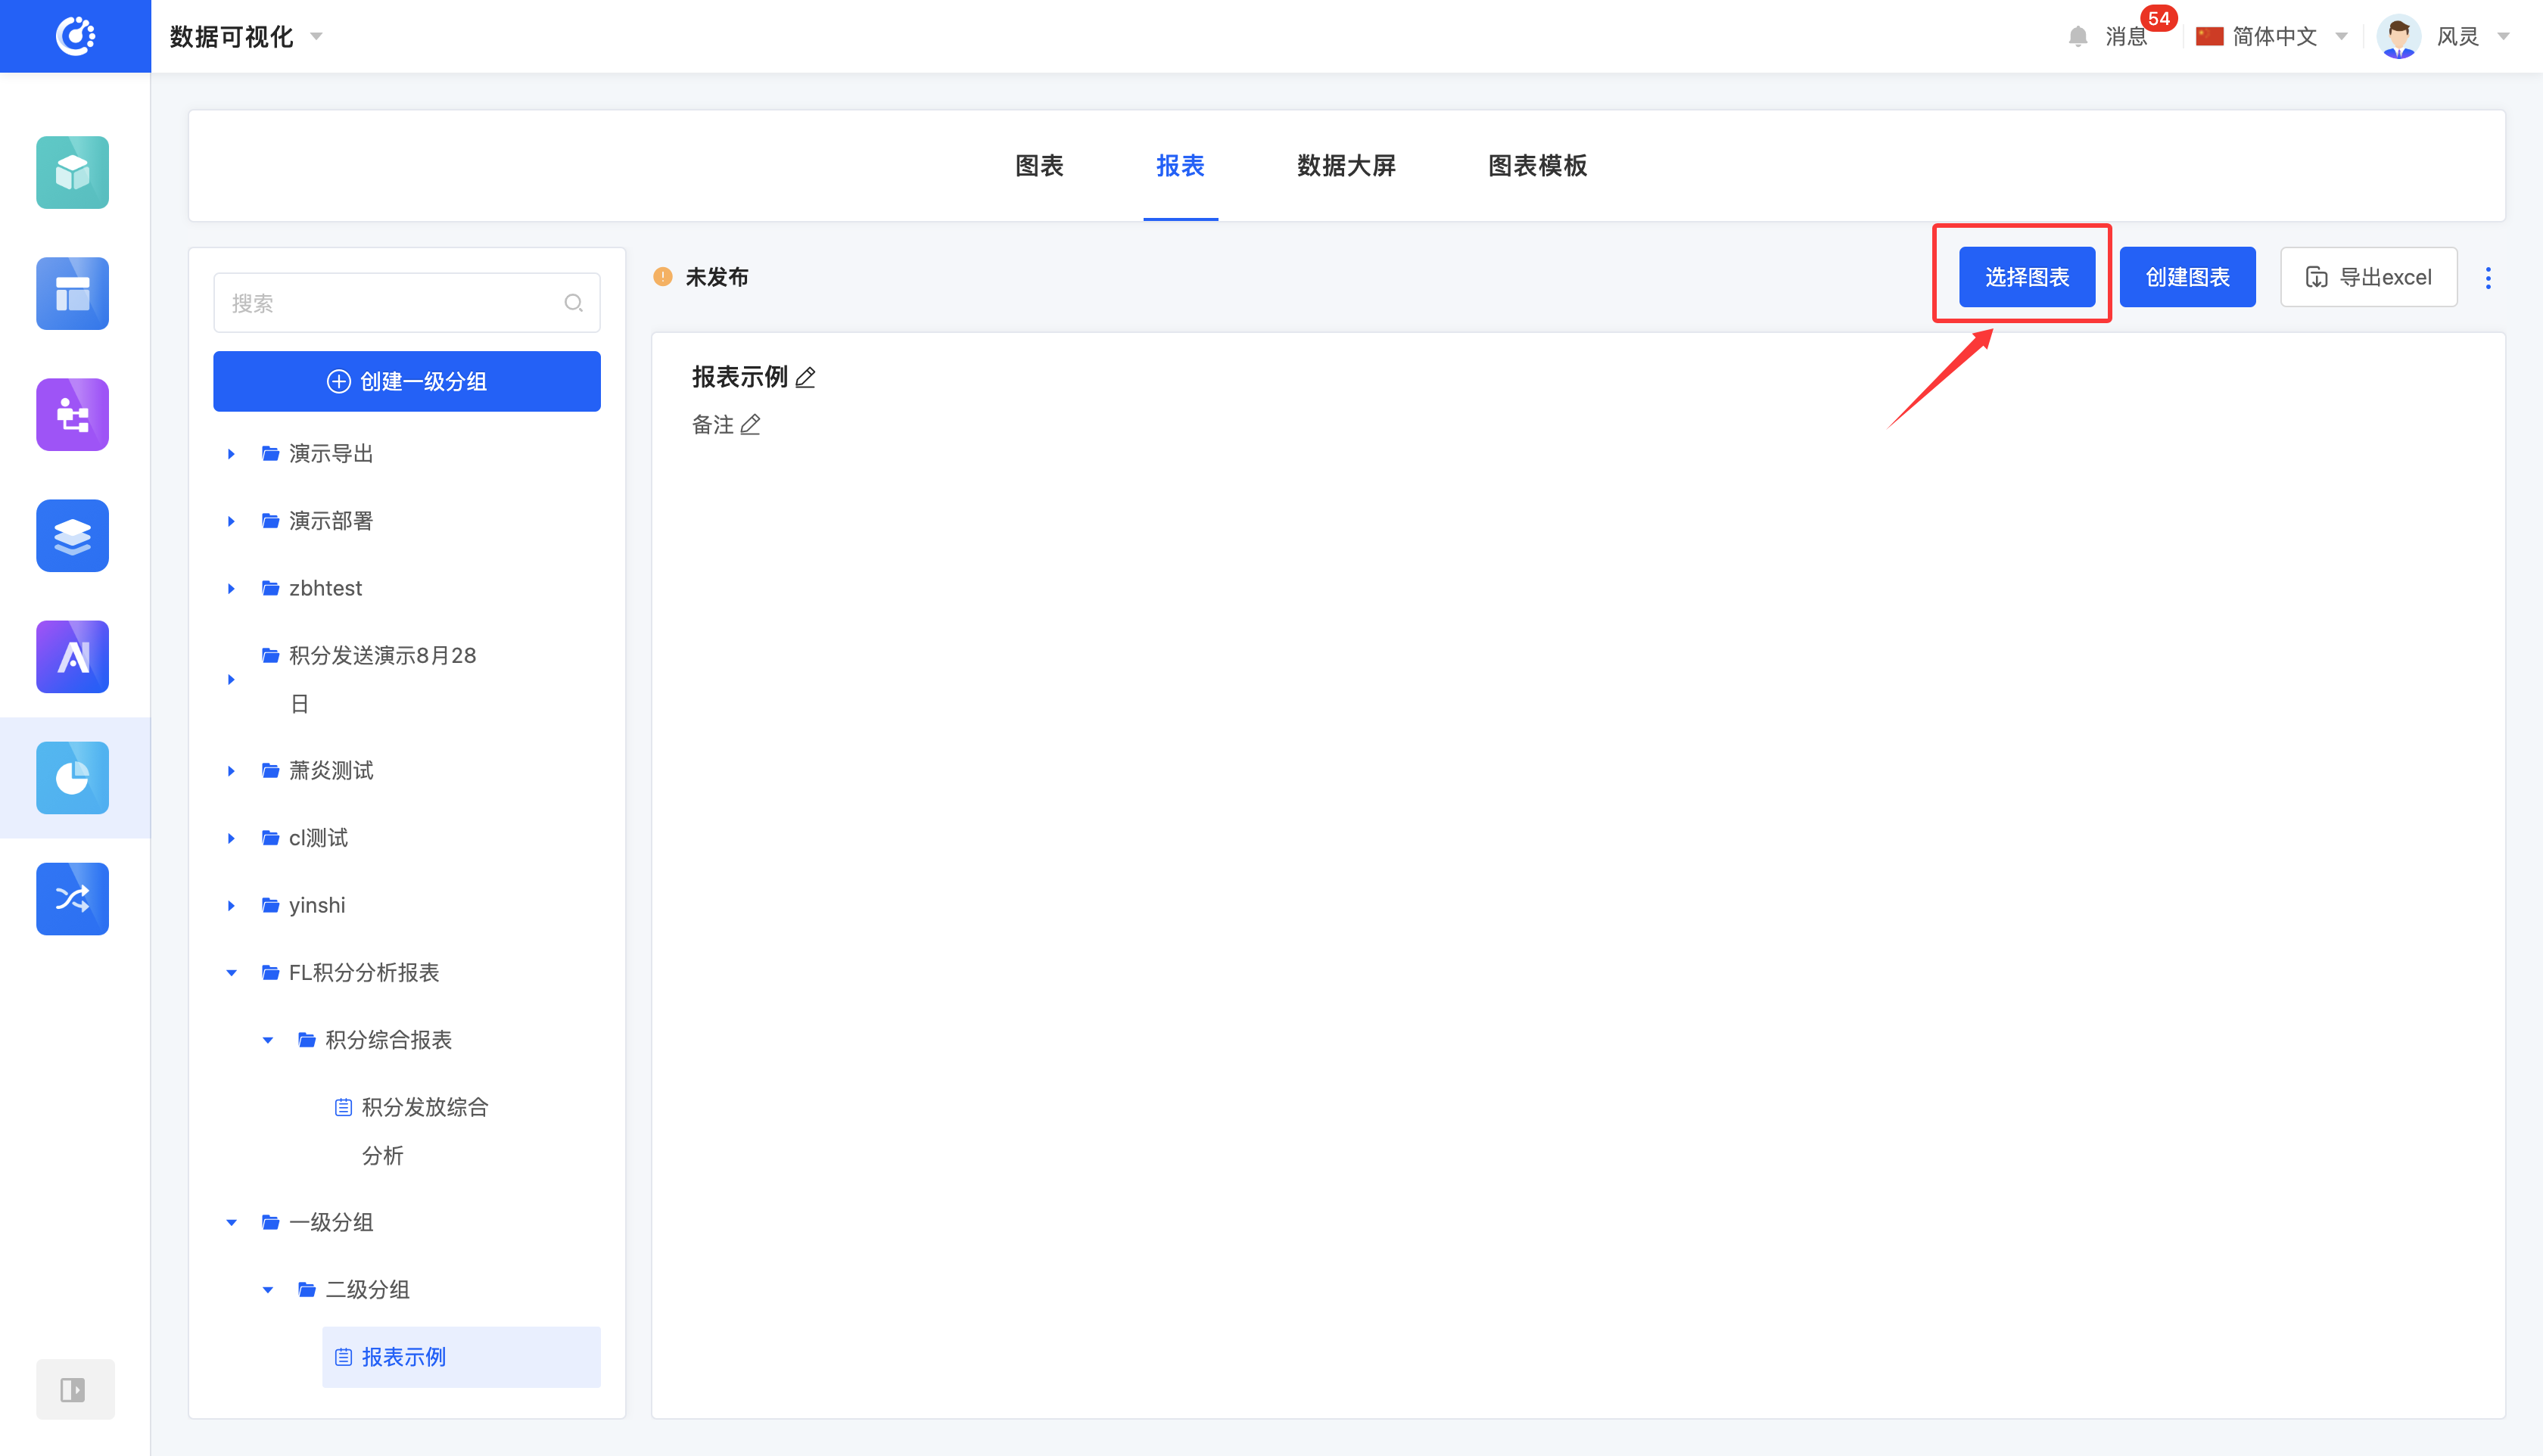
V. Select Charts
1. Function Introduction
You can select the charts to be displayed in the report.
Note
- Only charts under the same first-level group can be selected.
- When there are already charts in the report preview area, only charts under the same first-level group as the existing charts can be selected.
2. Operation Method
Click "Select Charts". In the pop-up window, you can select the charts created in the data visualization section. The selected charts will be displayed in the report preview area.
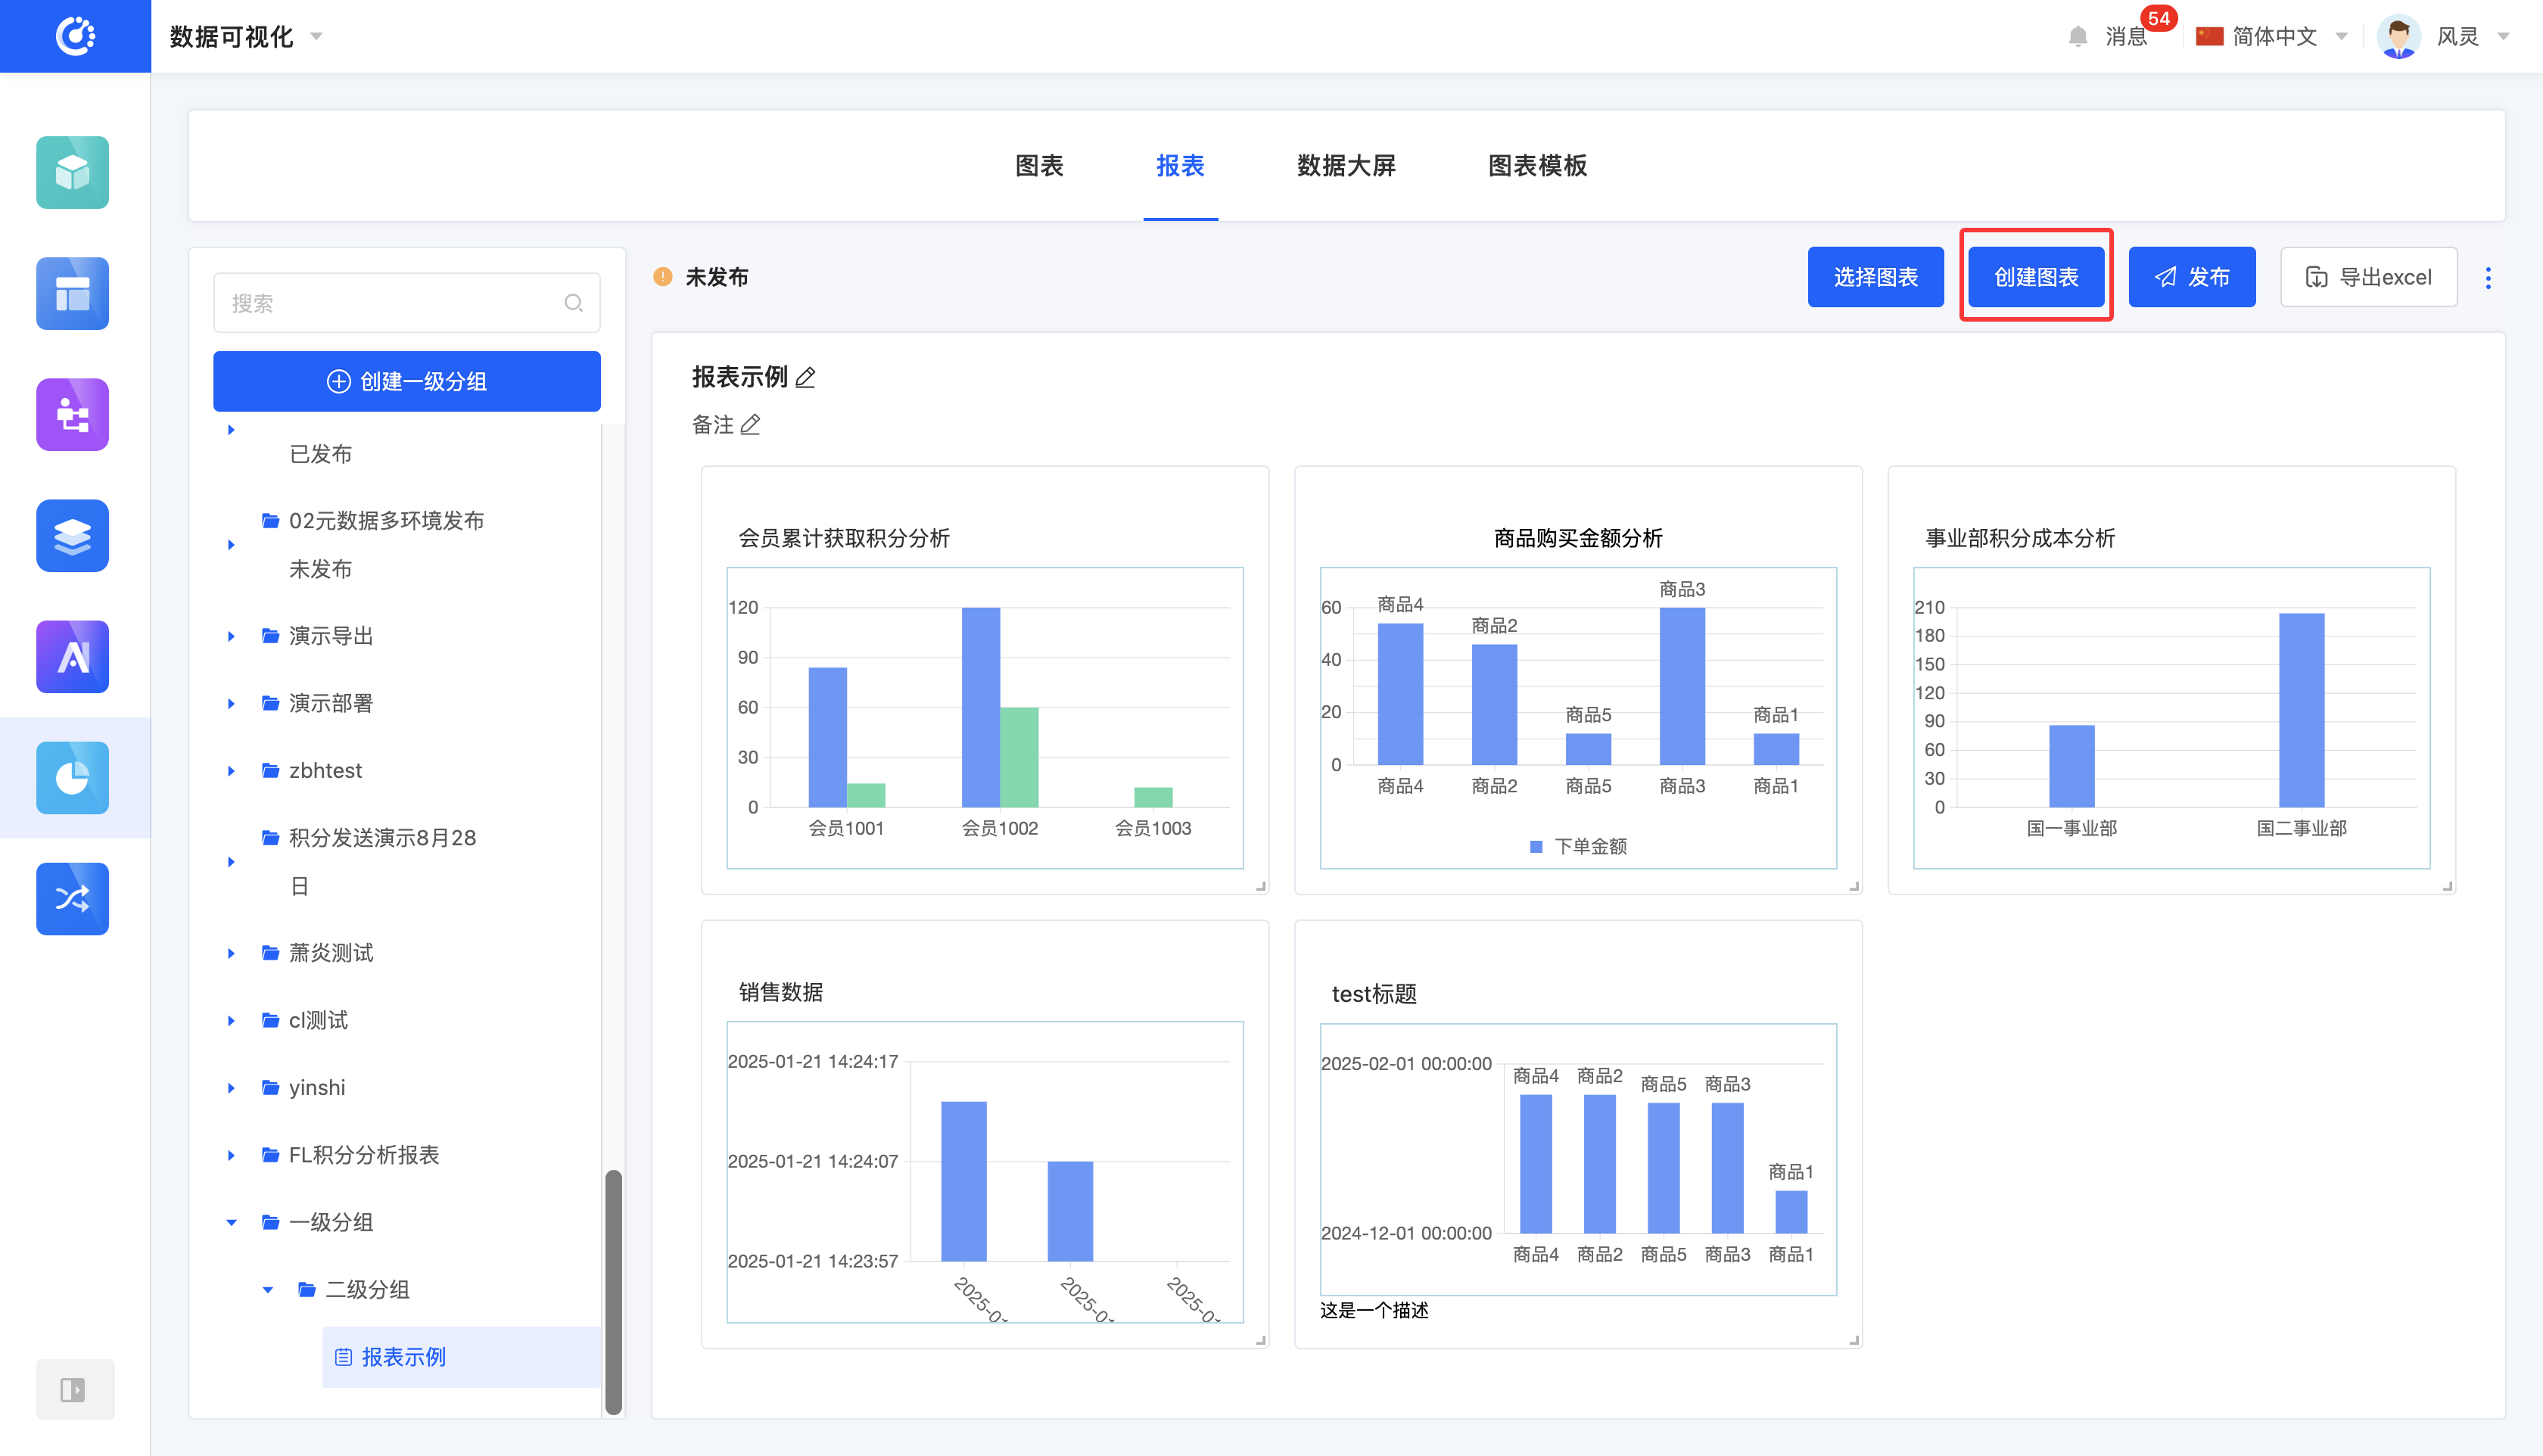
VI. Create a Chart
1. Function Introduction
Provides a quick entry for creating charts. For detailed information on creating charts, refer to the "Chart Management" document.
2. Operation Method
Click "Create Chart", enter the information, and the chart will be successfully created.
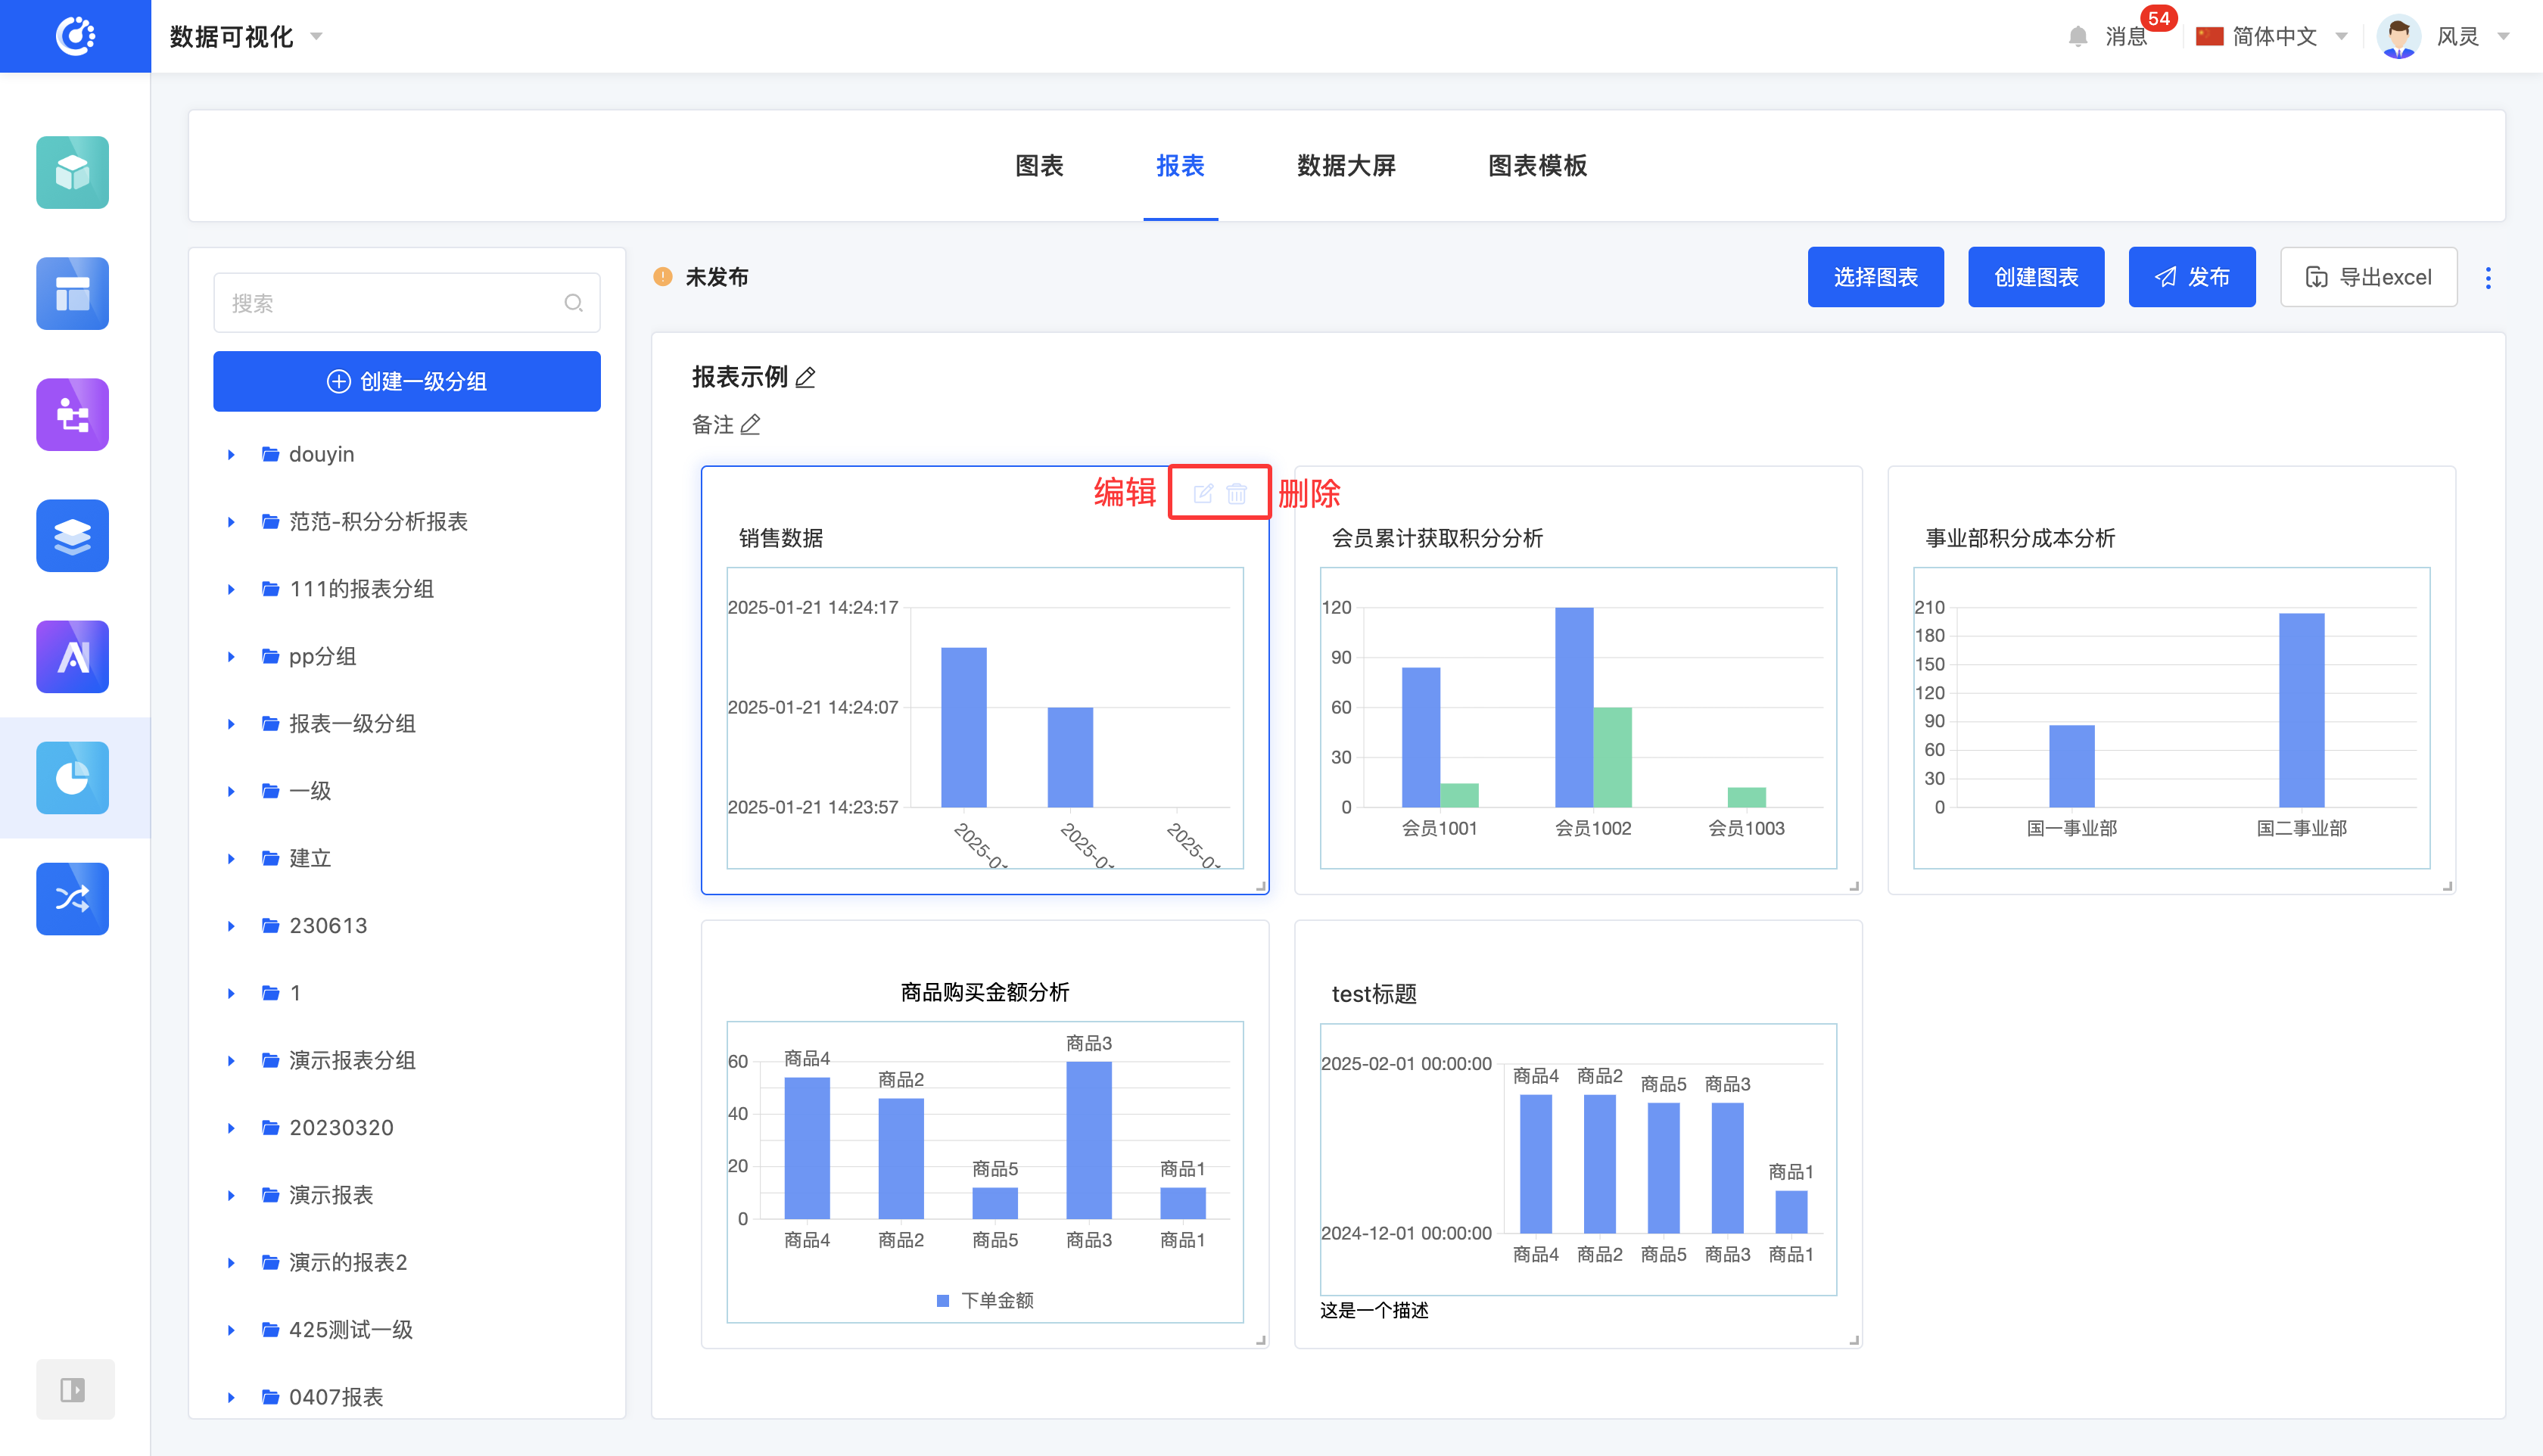
VII. Design a Report
1. Function Introduction
When the report preview area contains charts, you can freely adjust the position and size of the charts in this area to meet the display requirements. If a chart is no longer needed, you can delete it. In addition, a quick entry for chart editing is provided, allowing you to quickly jump to the chart design interface for further adjustment and optimization of the chart.
2. Operation Method
- Drag the chart to change its position.
- Drag the bottom-right corner of the chart to change its size.
- Select a chart, click the "Edit" icon, and you will jump to the chart design page.
- Select a chart, click the "Delete" icon, and the chart will be deleted.
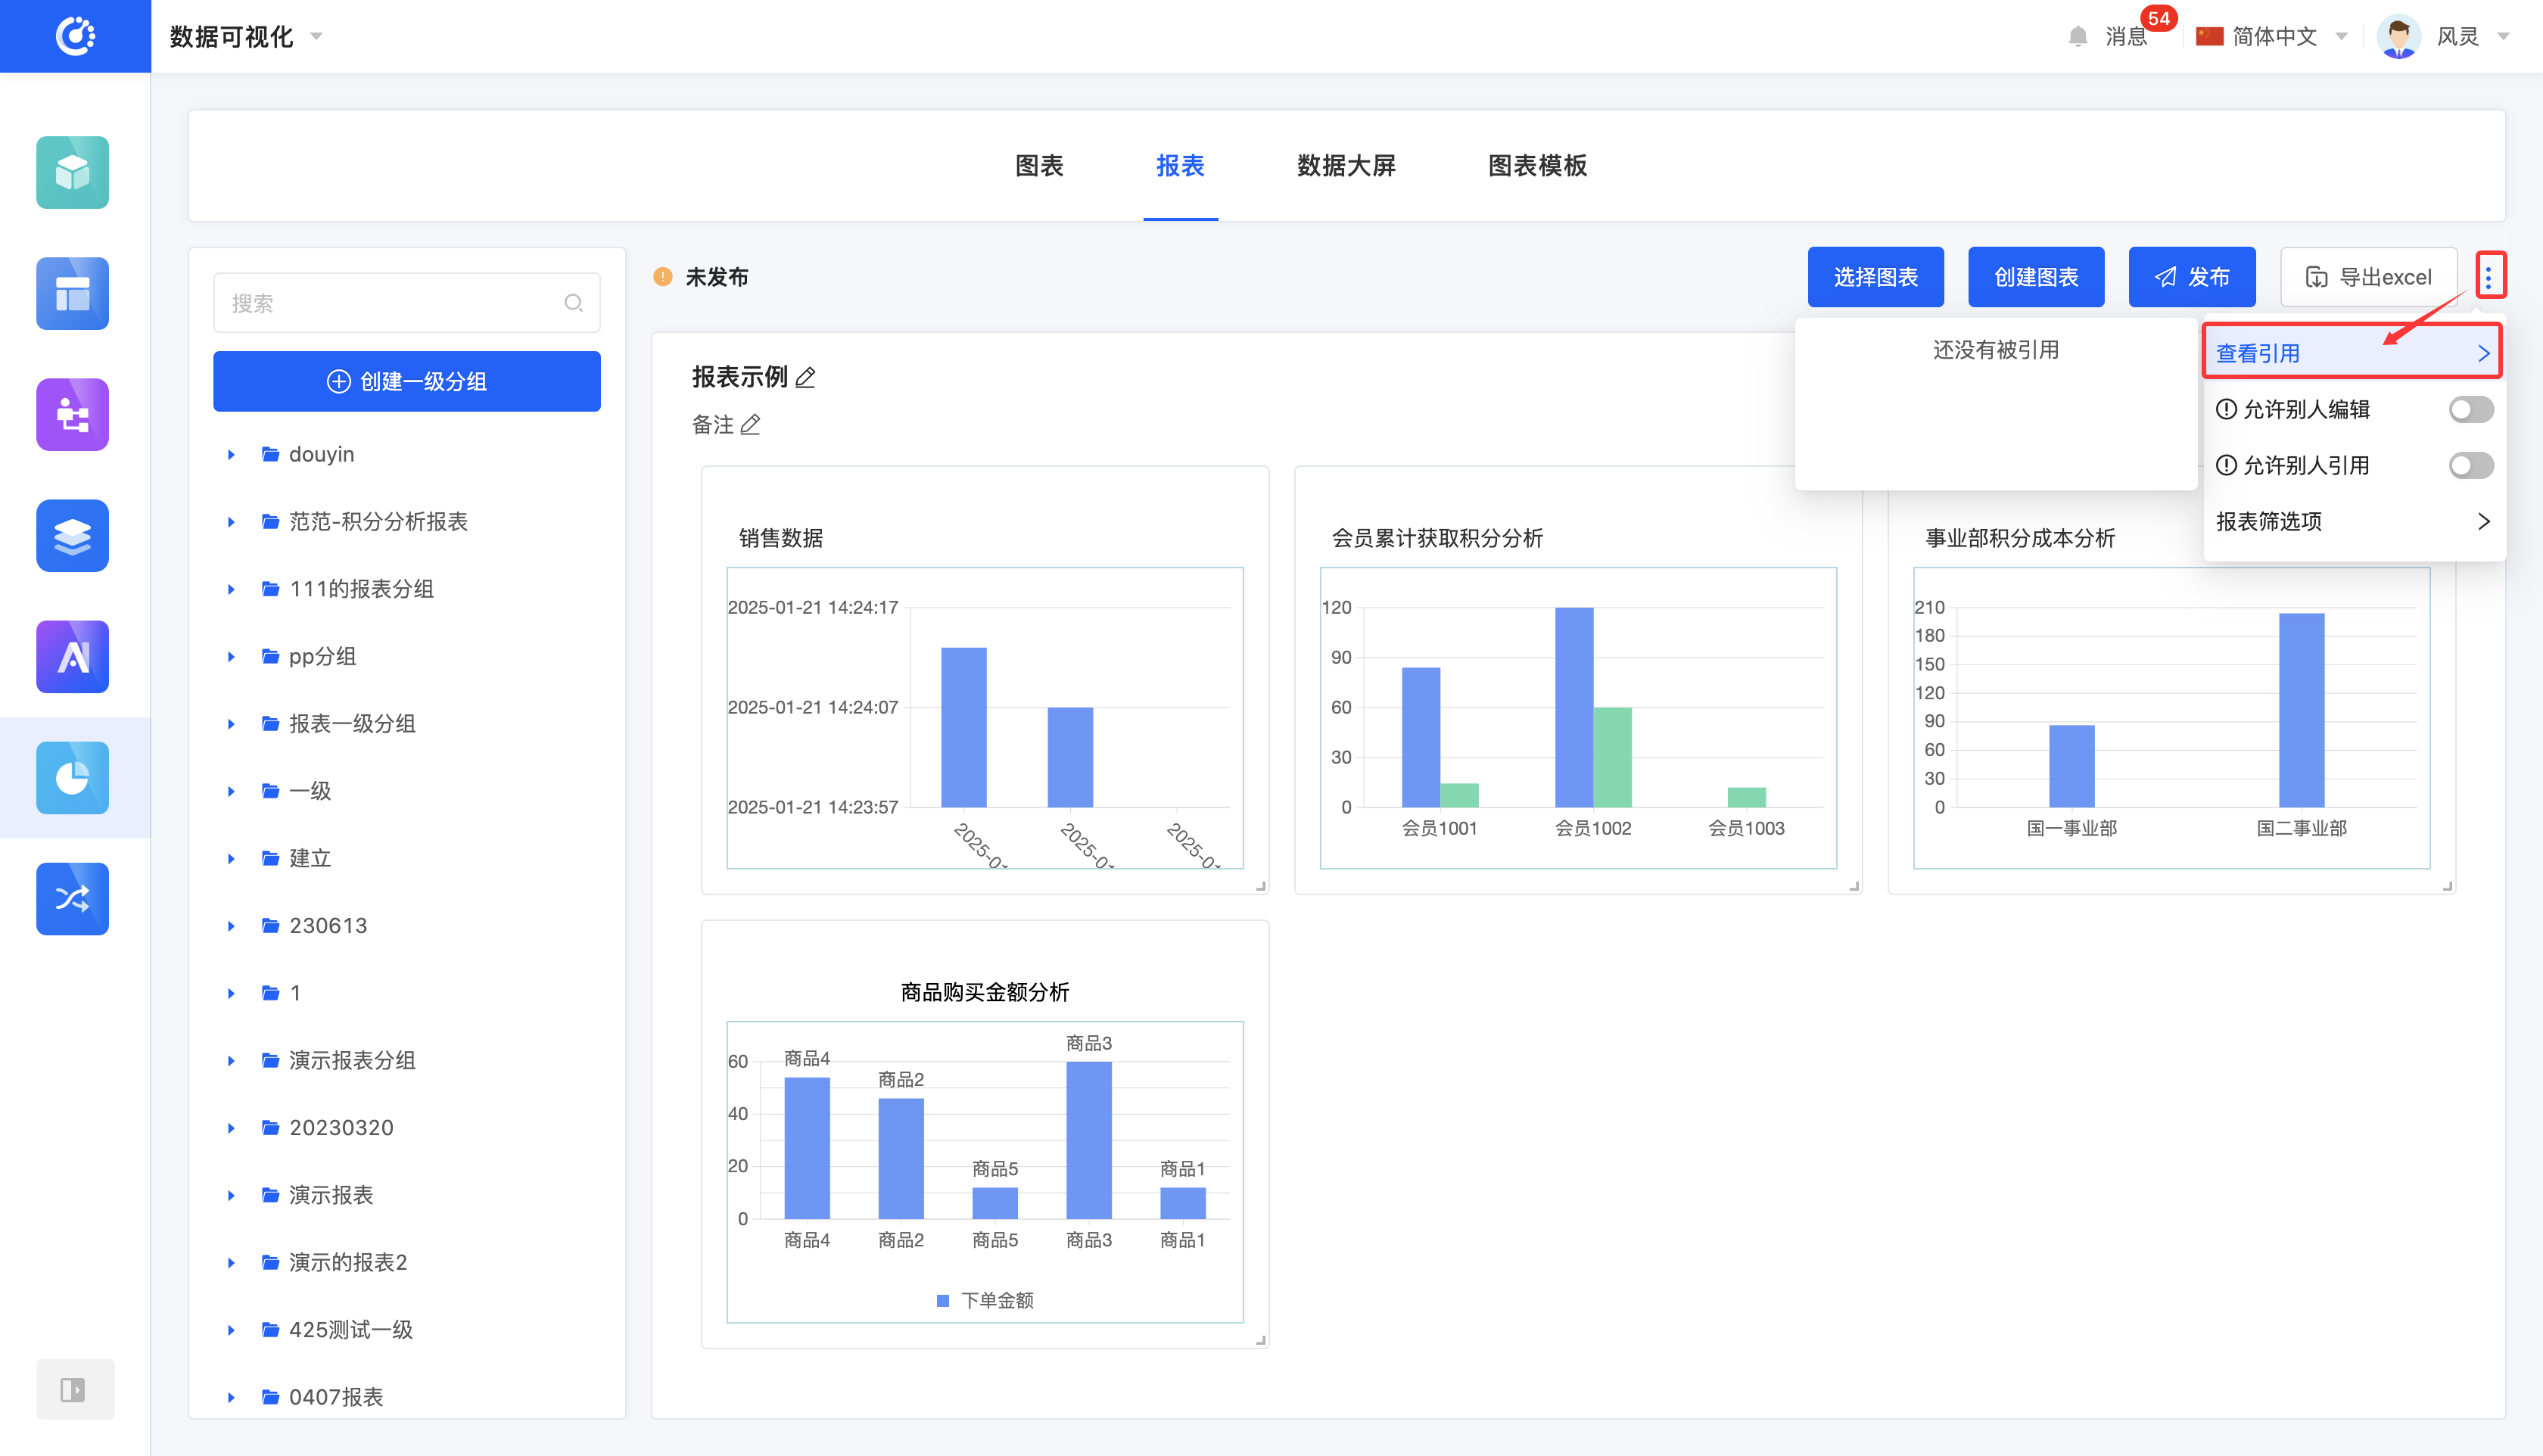
VIII. View Reference Information
1. Function Introduction
You can view various elements that have a reference relationship with the report.
Note
- For published reports, a reference link is provided, which can be directly copied and used elsewhere.
- For unpublished reports, no reference link is provided.
2. Operation Method
Click "View Reference" to view the reference information.
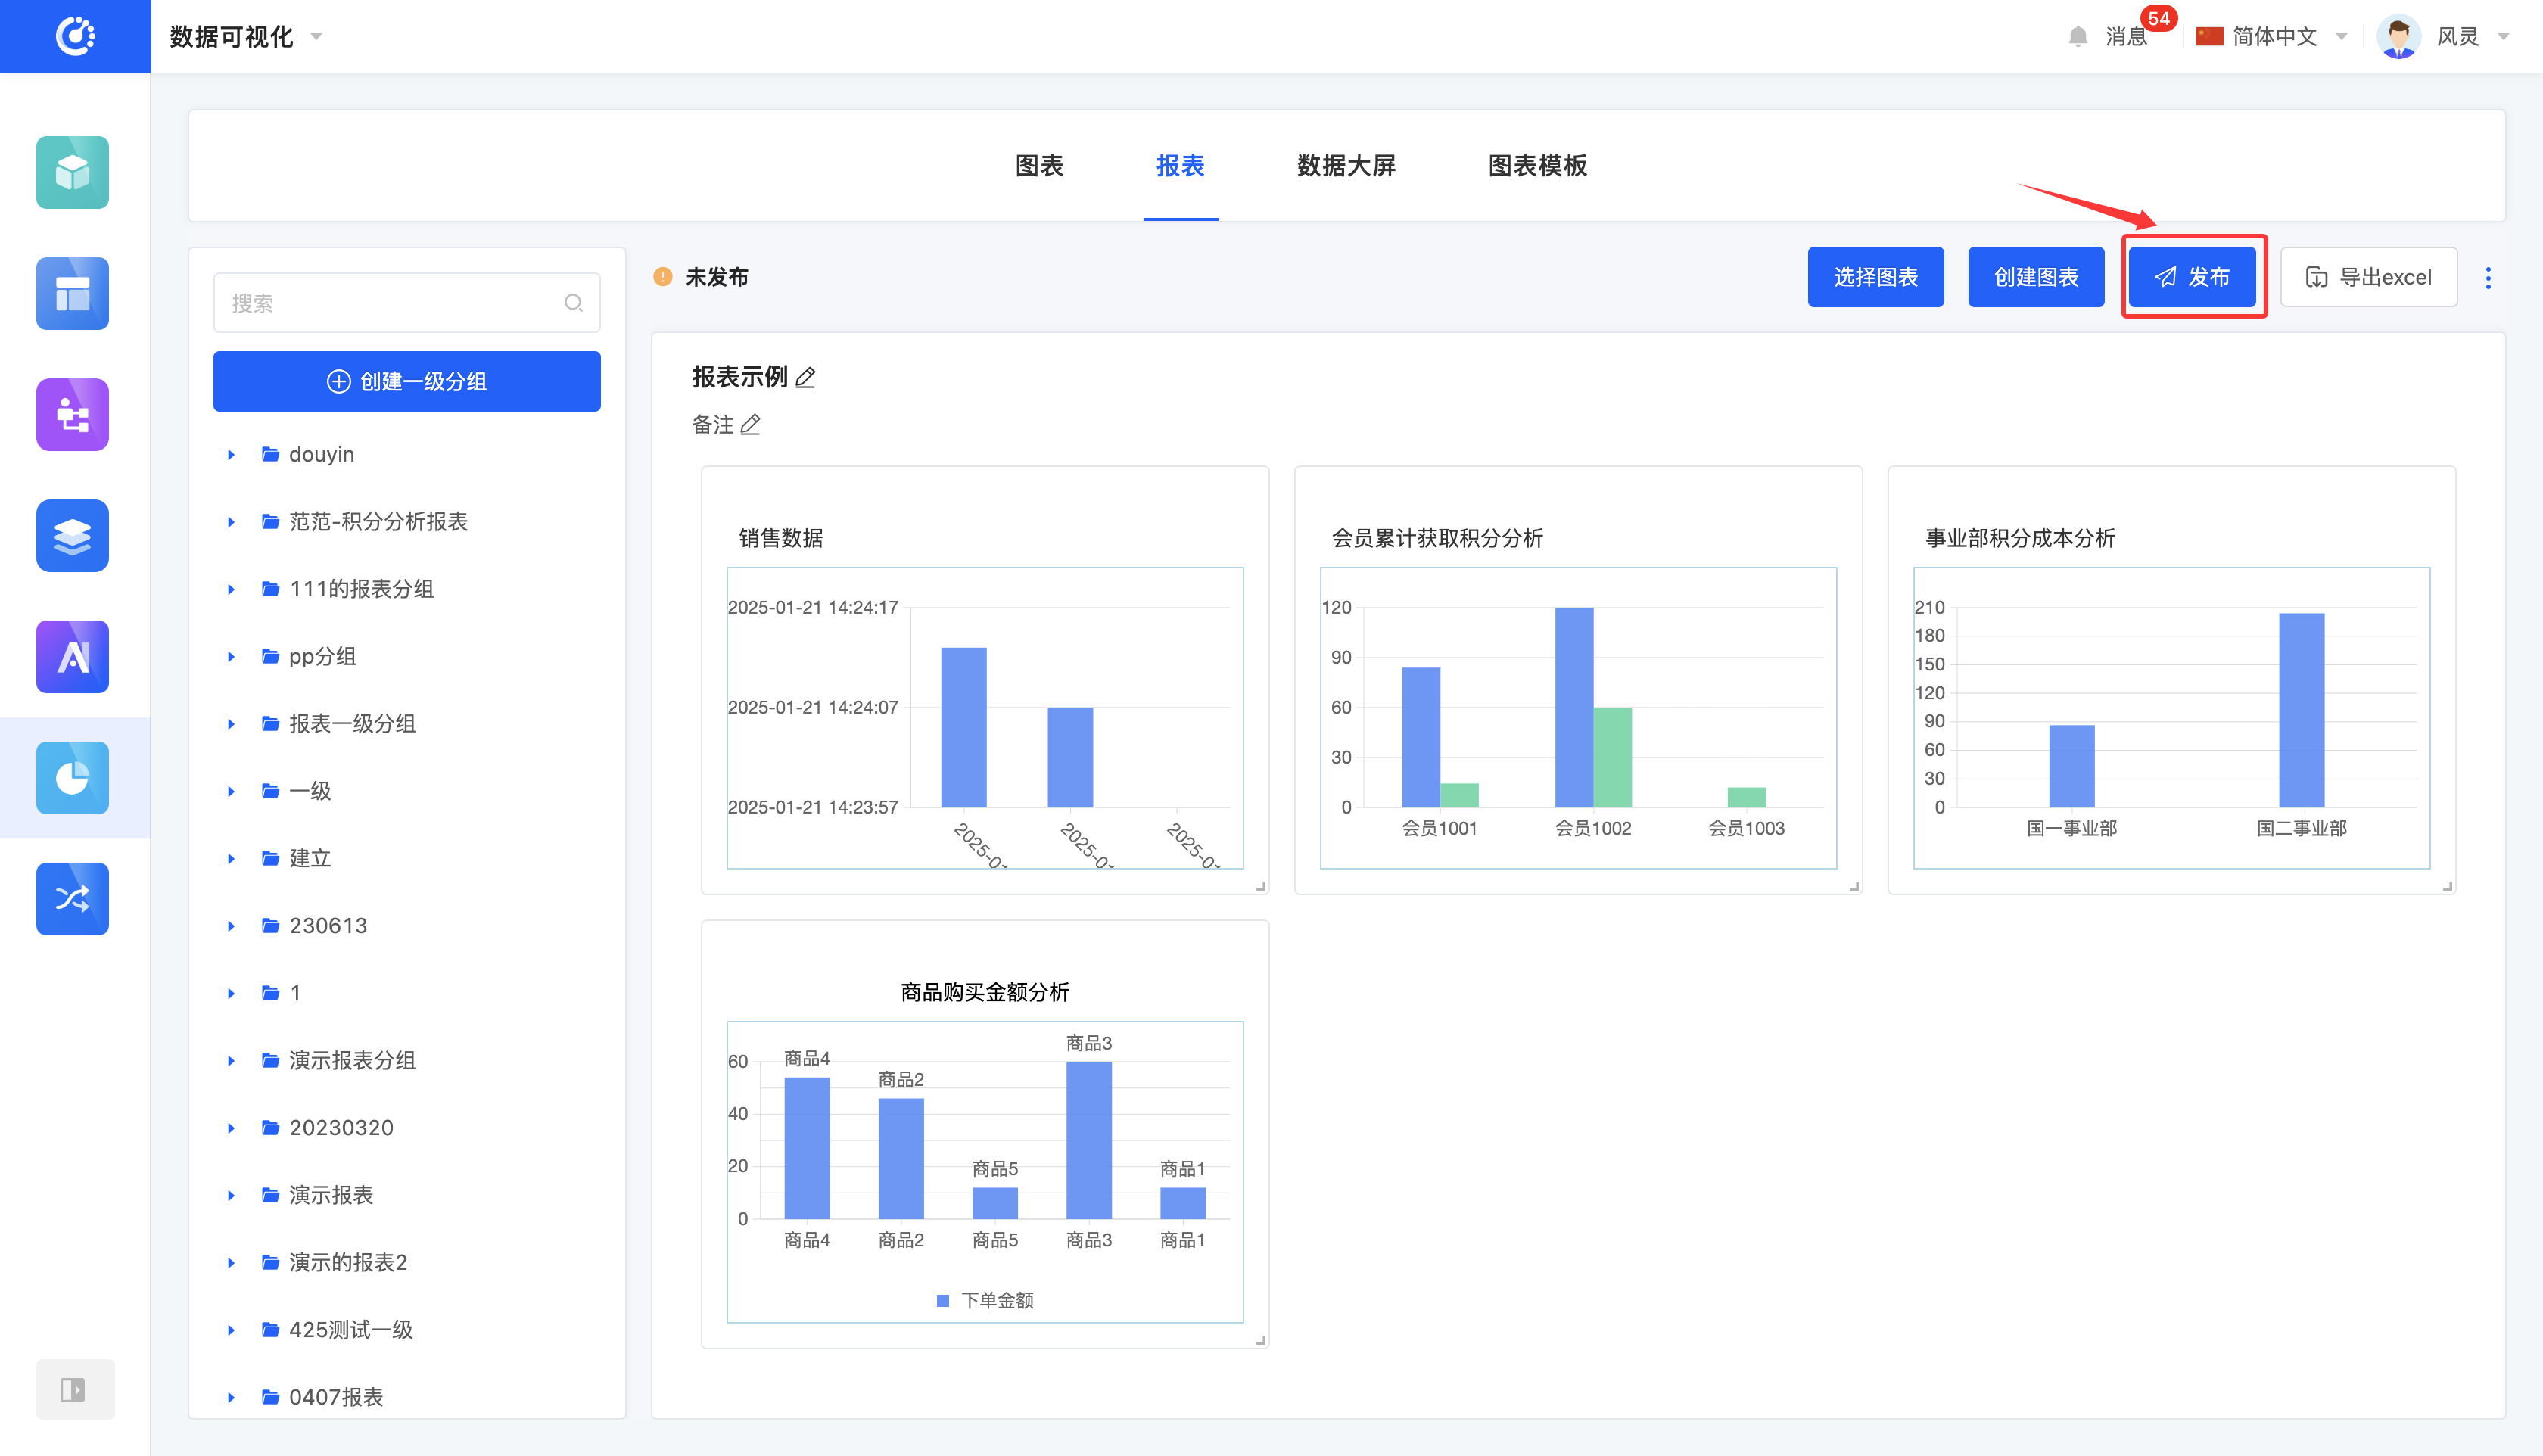
IX. Publish a Report
1. Function Introduction
After the report is designed, users can choose to publish the report. The published report can be referenced in other designers, and the latest publication time will be displayed. If the report content is updated after publication, the original "Publish" button will change to "Update and Publish".
Note
- If the content is updated but not republished, the places referencing the report will continue to display the old version of the content.
- A hidden report cannot be published.
2. Operation Method
Click "Publish/Update and Publish" to successfully publish the report.
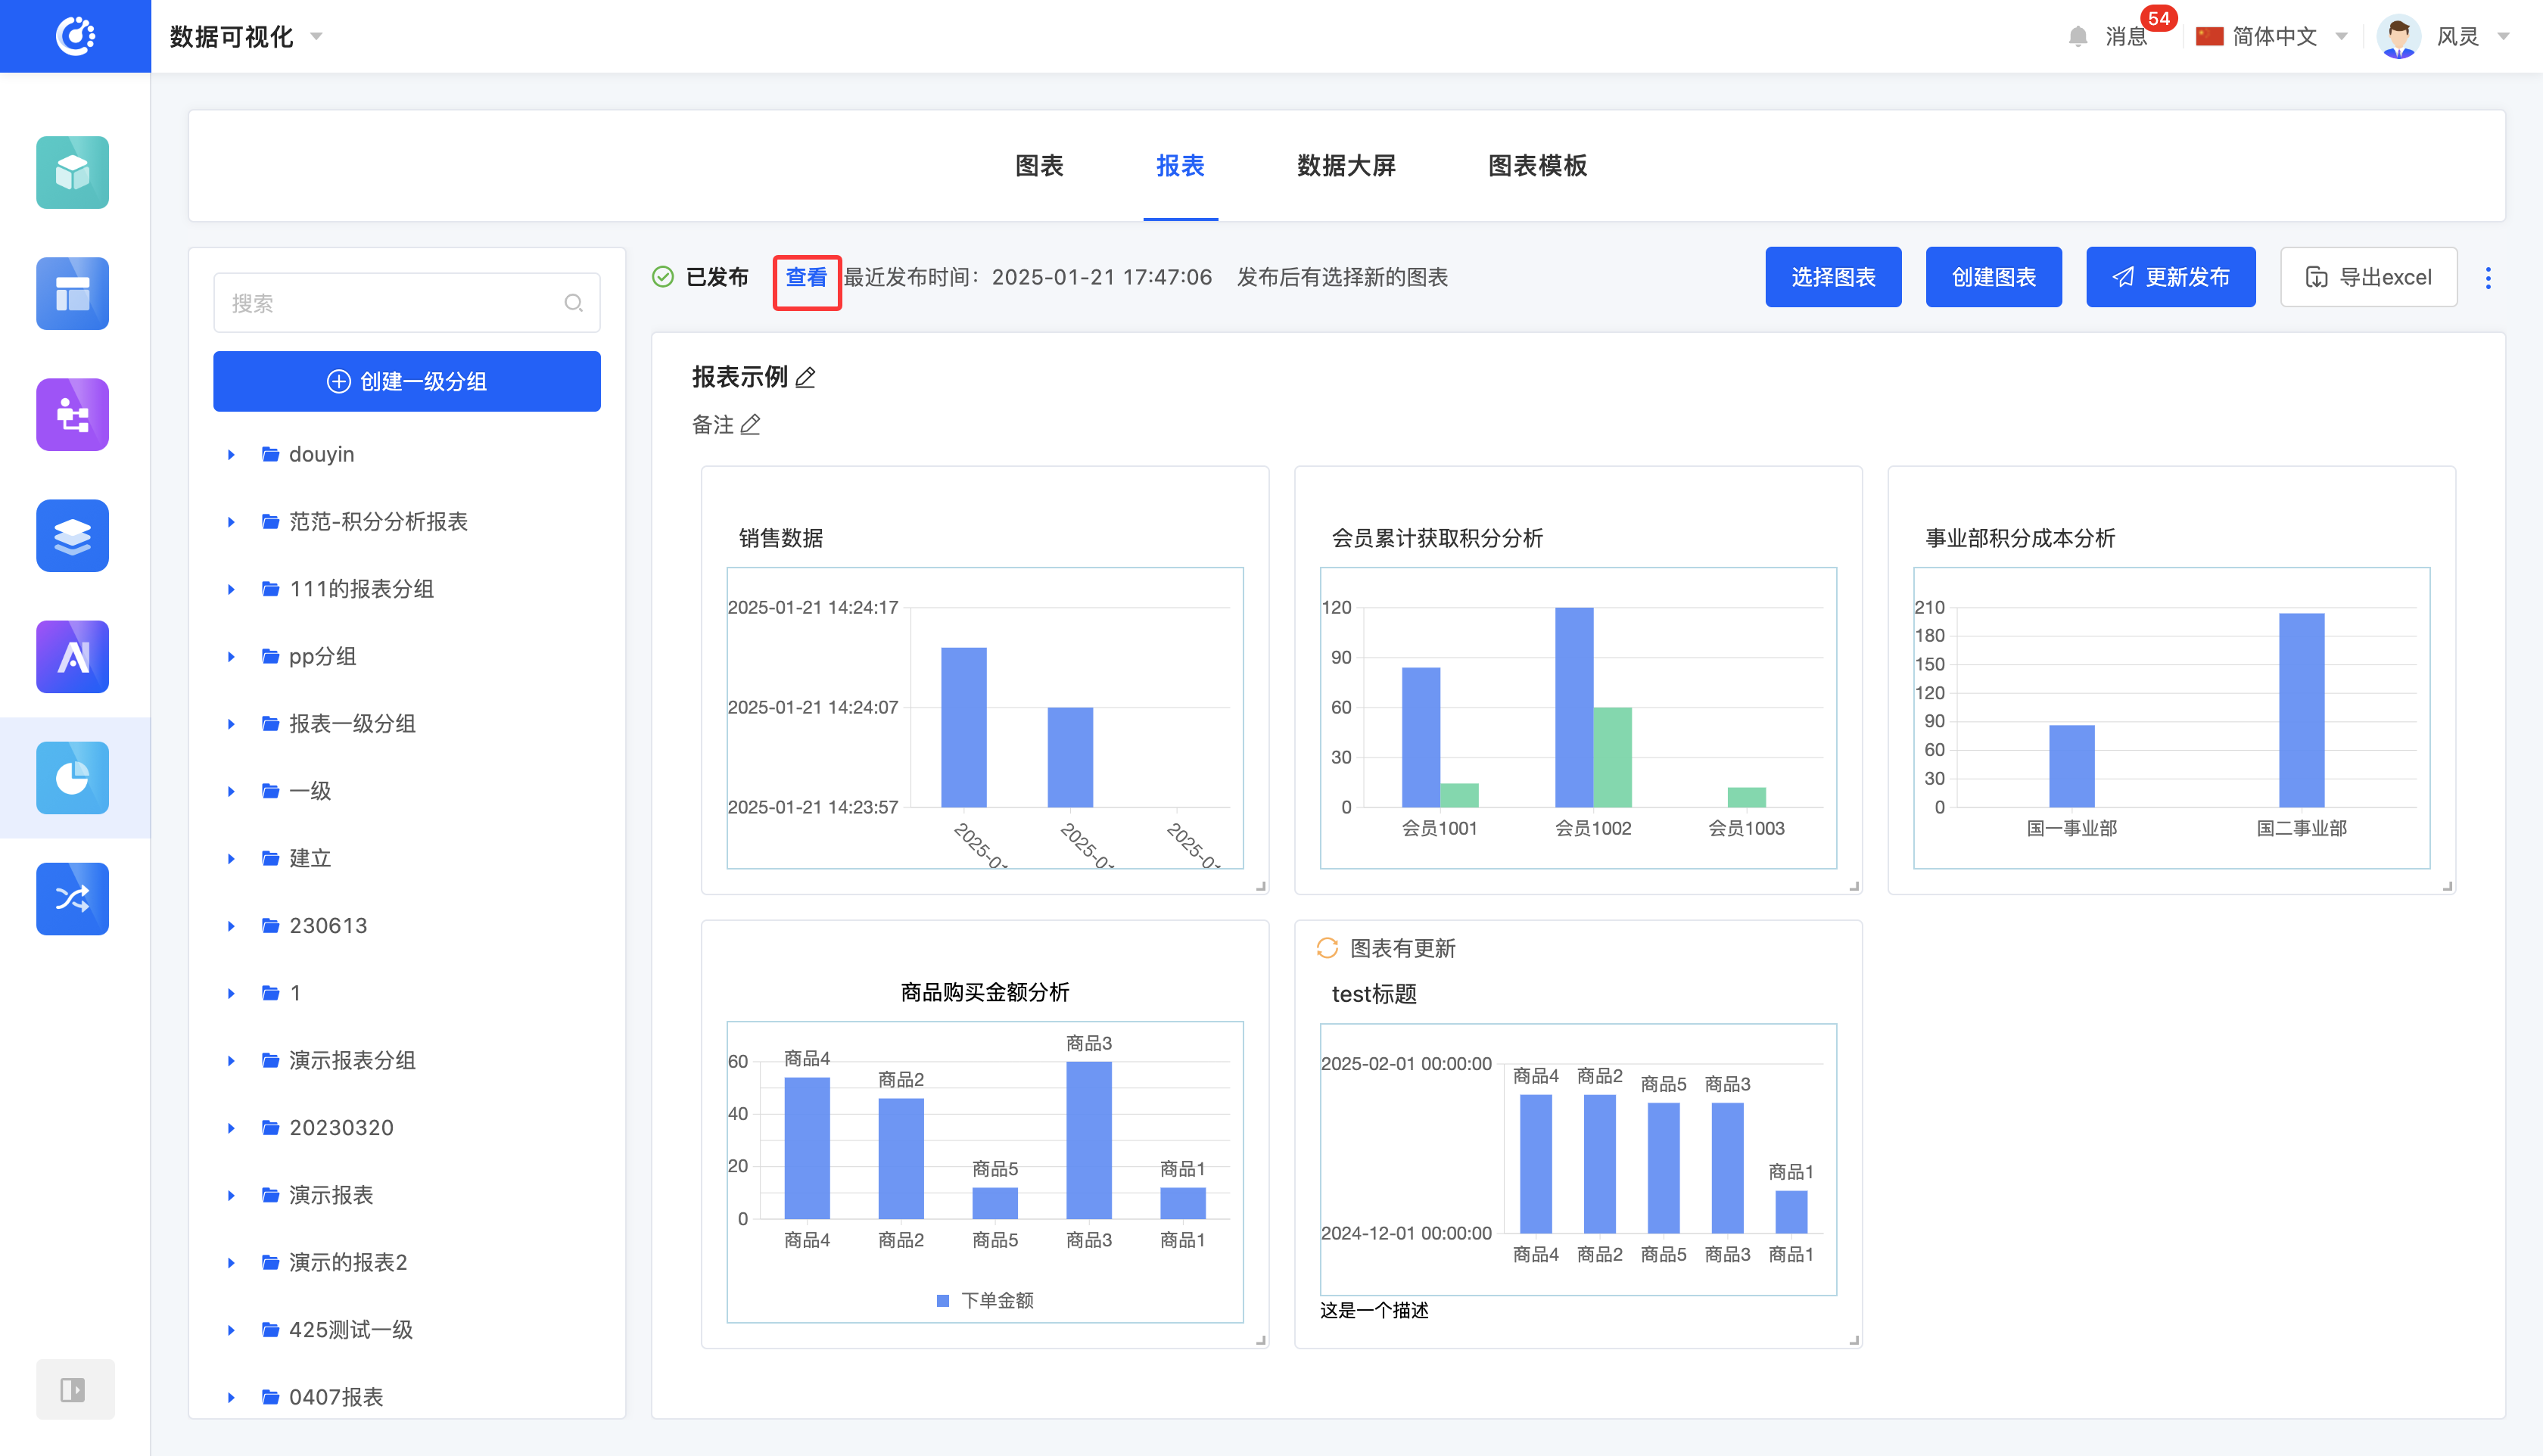
X. View the Latest Published Version
1. Function Introduction
When a published report is updated, the latest publication time will be displayed in the upper-left area of the report preview area, and you can view the latest published version.
2. Operation Method
Click "View", and the report preview area will display the latest published version.
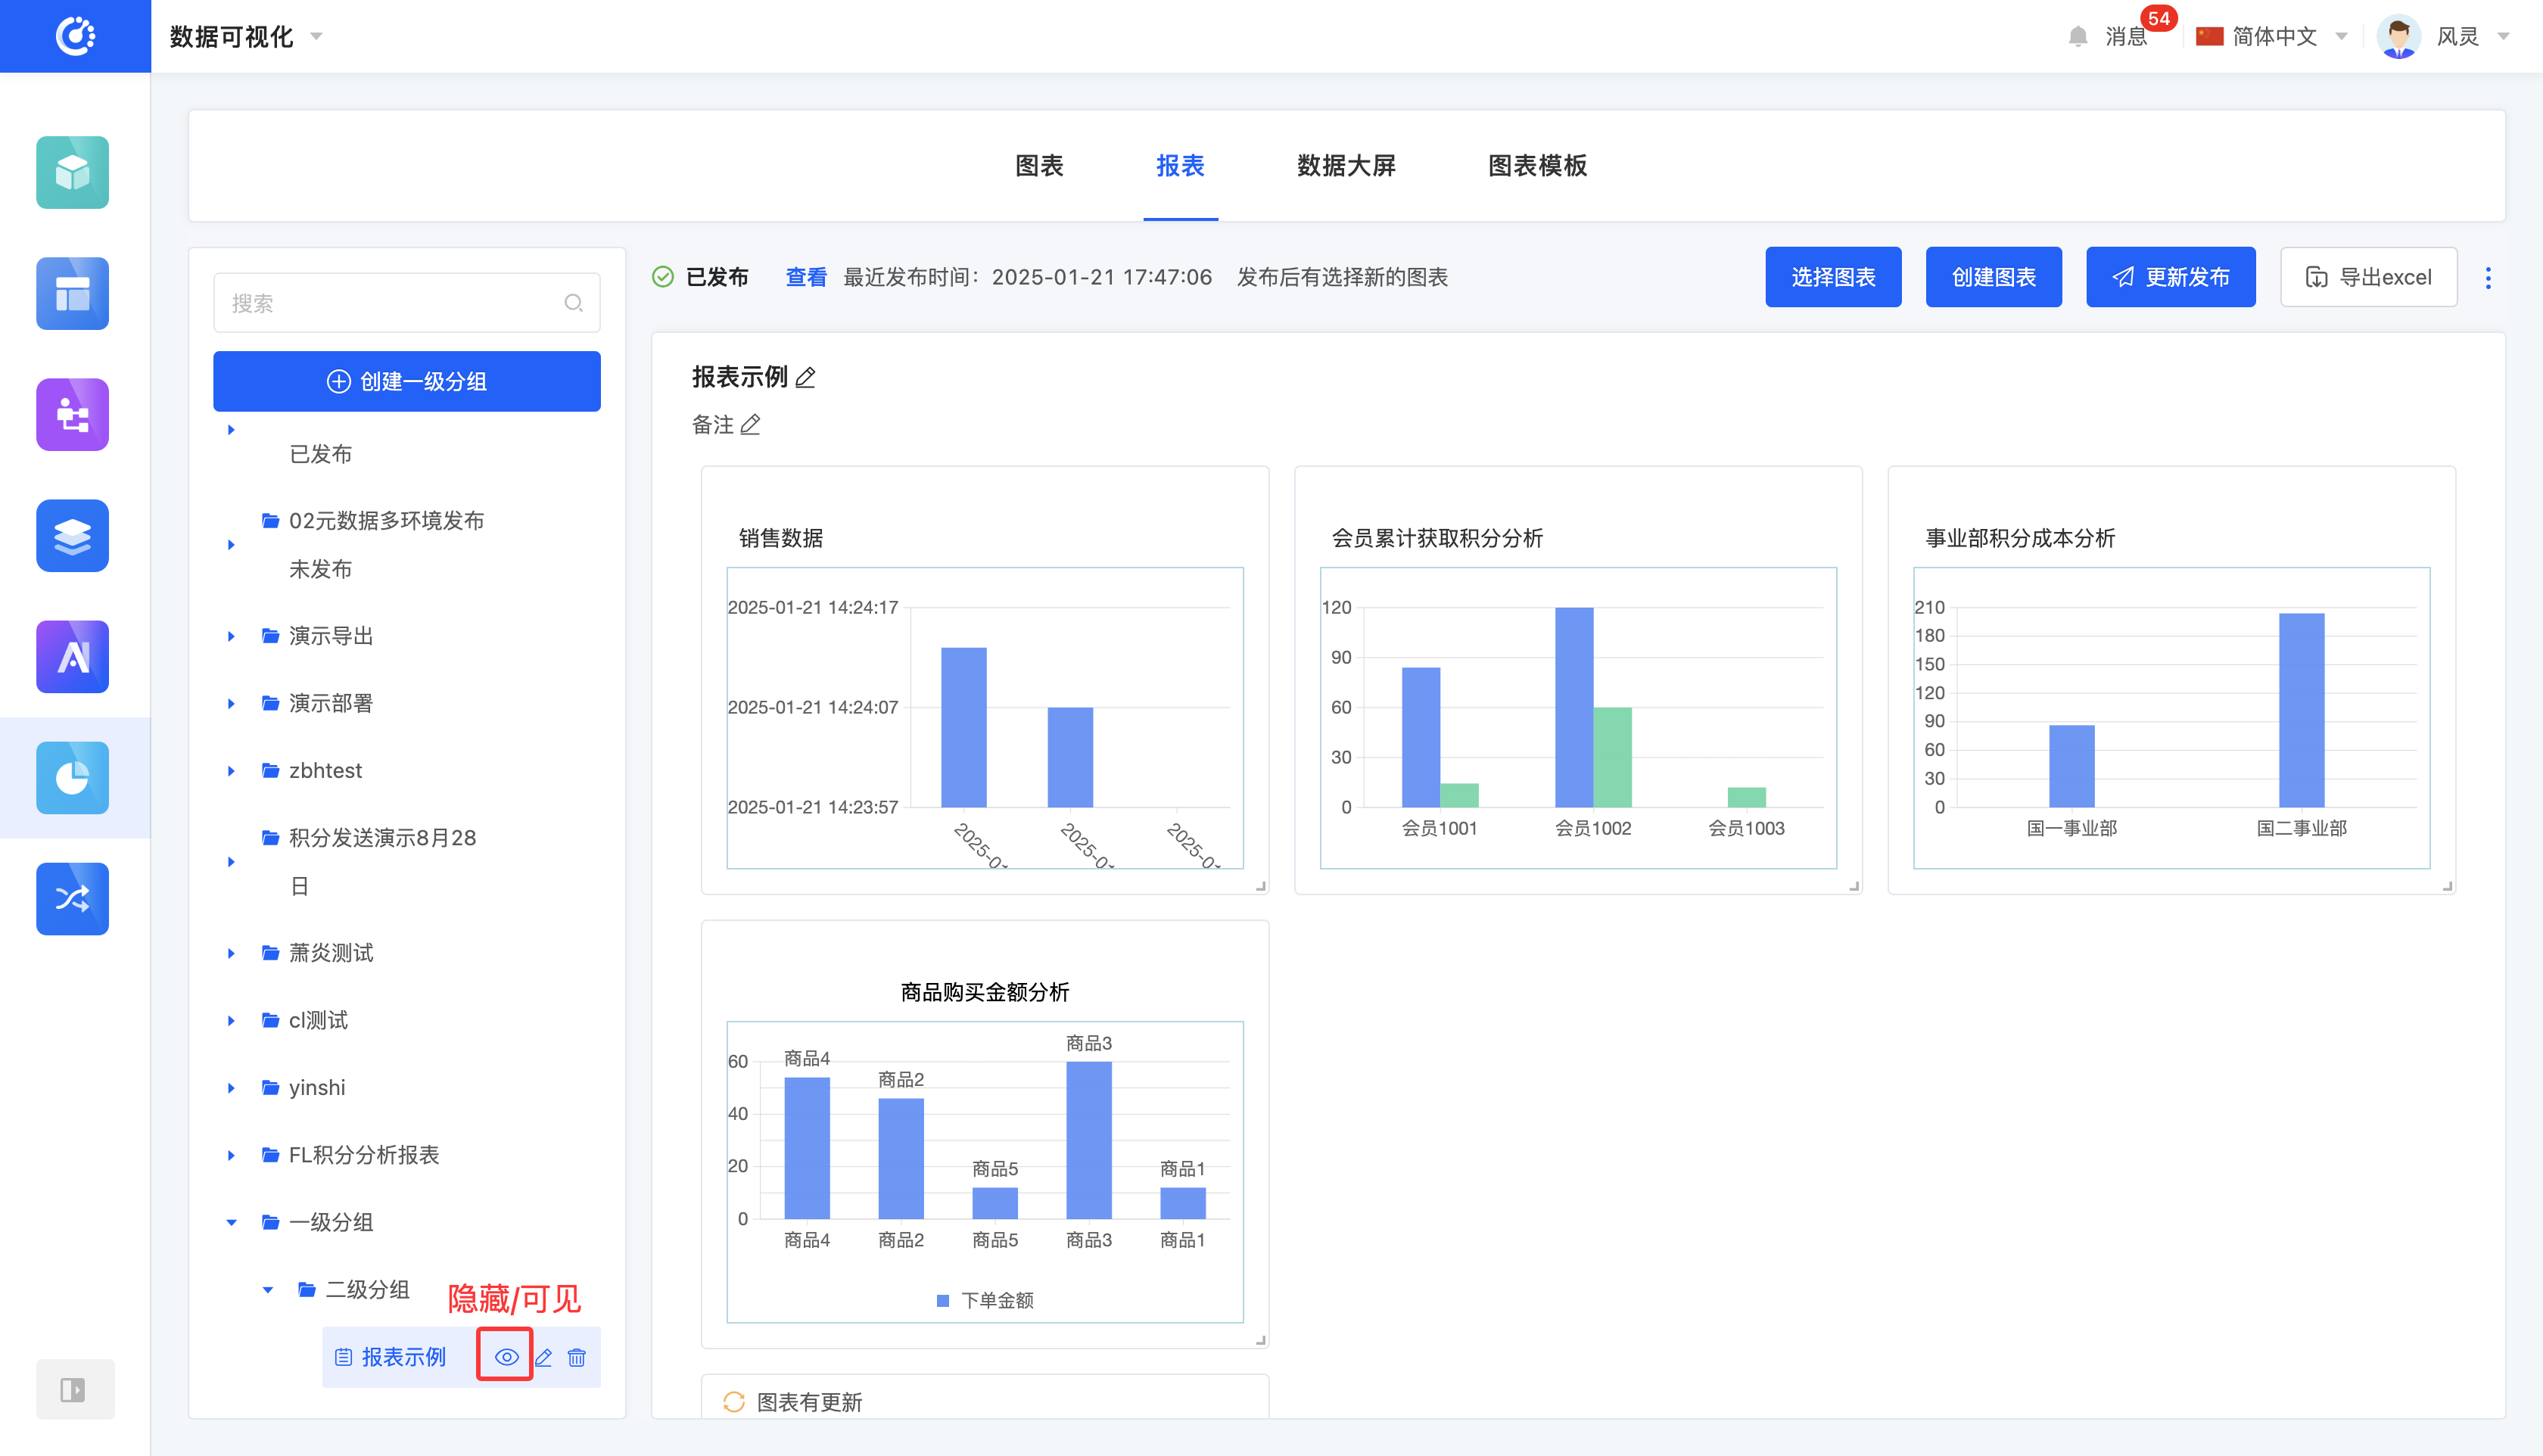
XI. Hide/Show a Report
1. Function Introduction
For reports that are not currently in use, you can perform a hide operation. If needed in the future, simply set the hidden report to the visible state to reuse it. A hidden report cannot be referenced, but it does not affect the already referenced data.
Note
- For published reports, after hiding, you cannot select charts, create charts, or publish/update and publish, but you can still design the report.
- For unpublished reports, after hiding, you cannot publish/update and publish, but you can still select charts, create charts, and design the report.
2. Operation Method
Click "Hide" to set the report to the hidden state; click again to restore the report to the visible state.
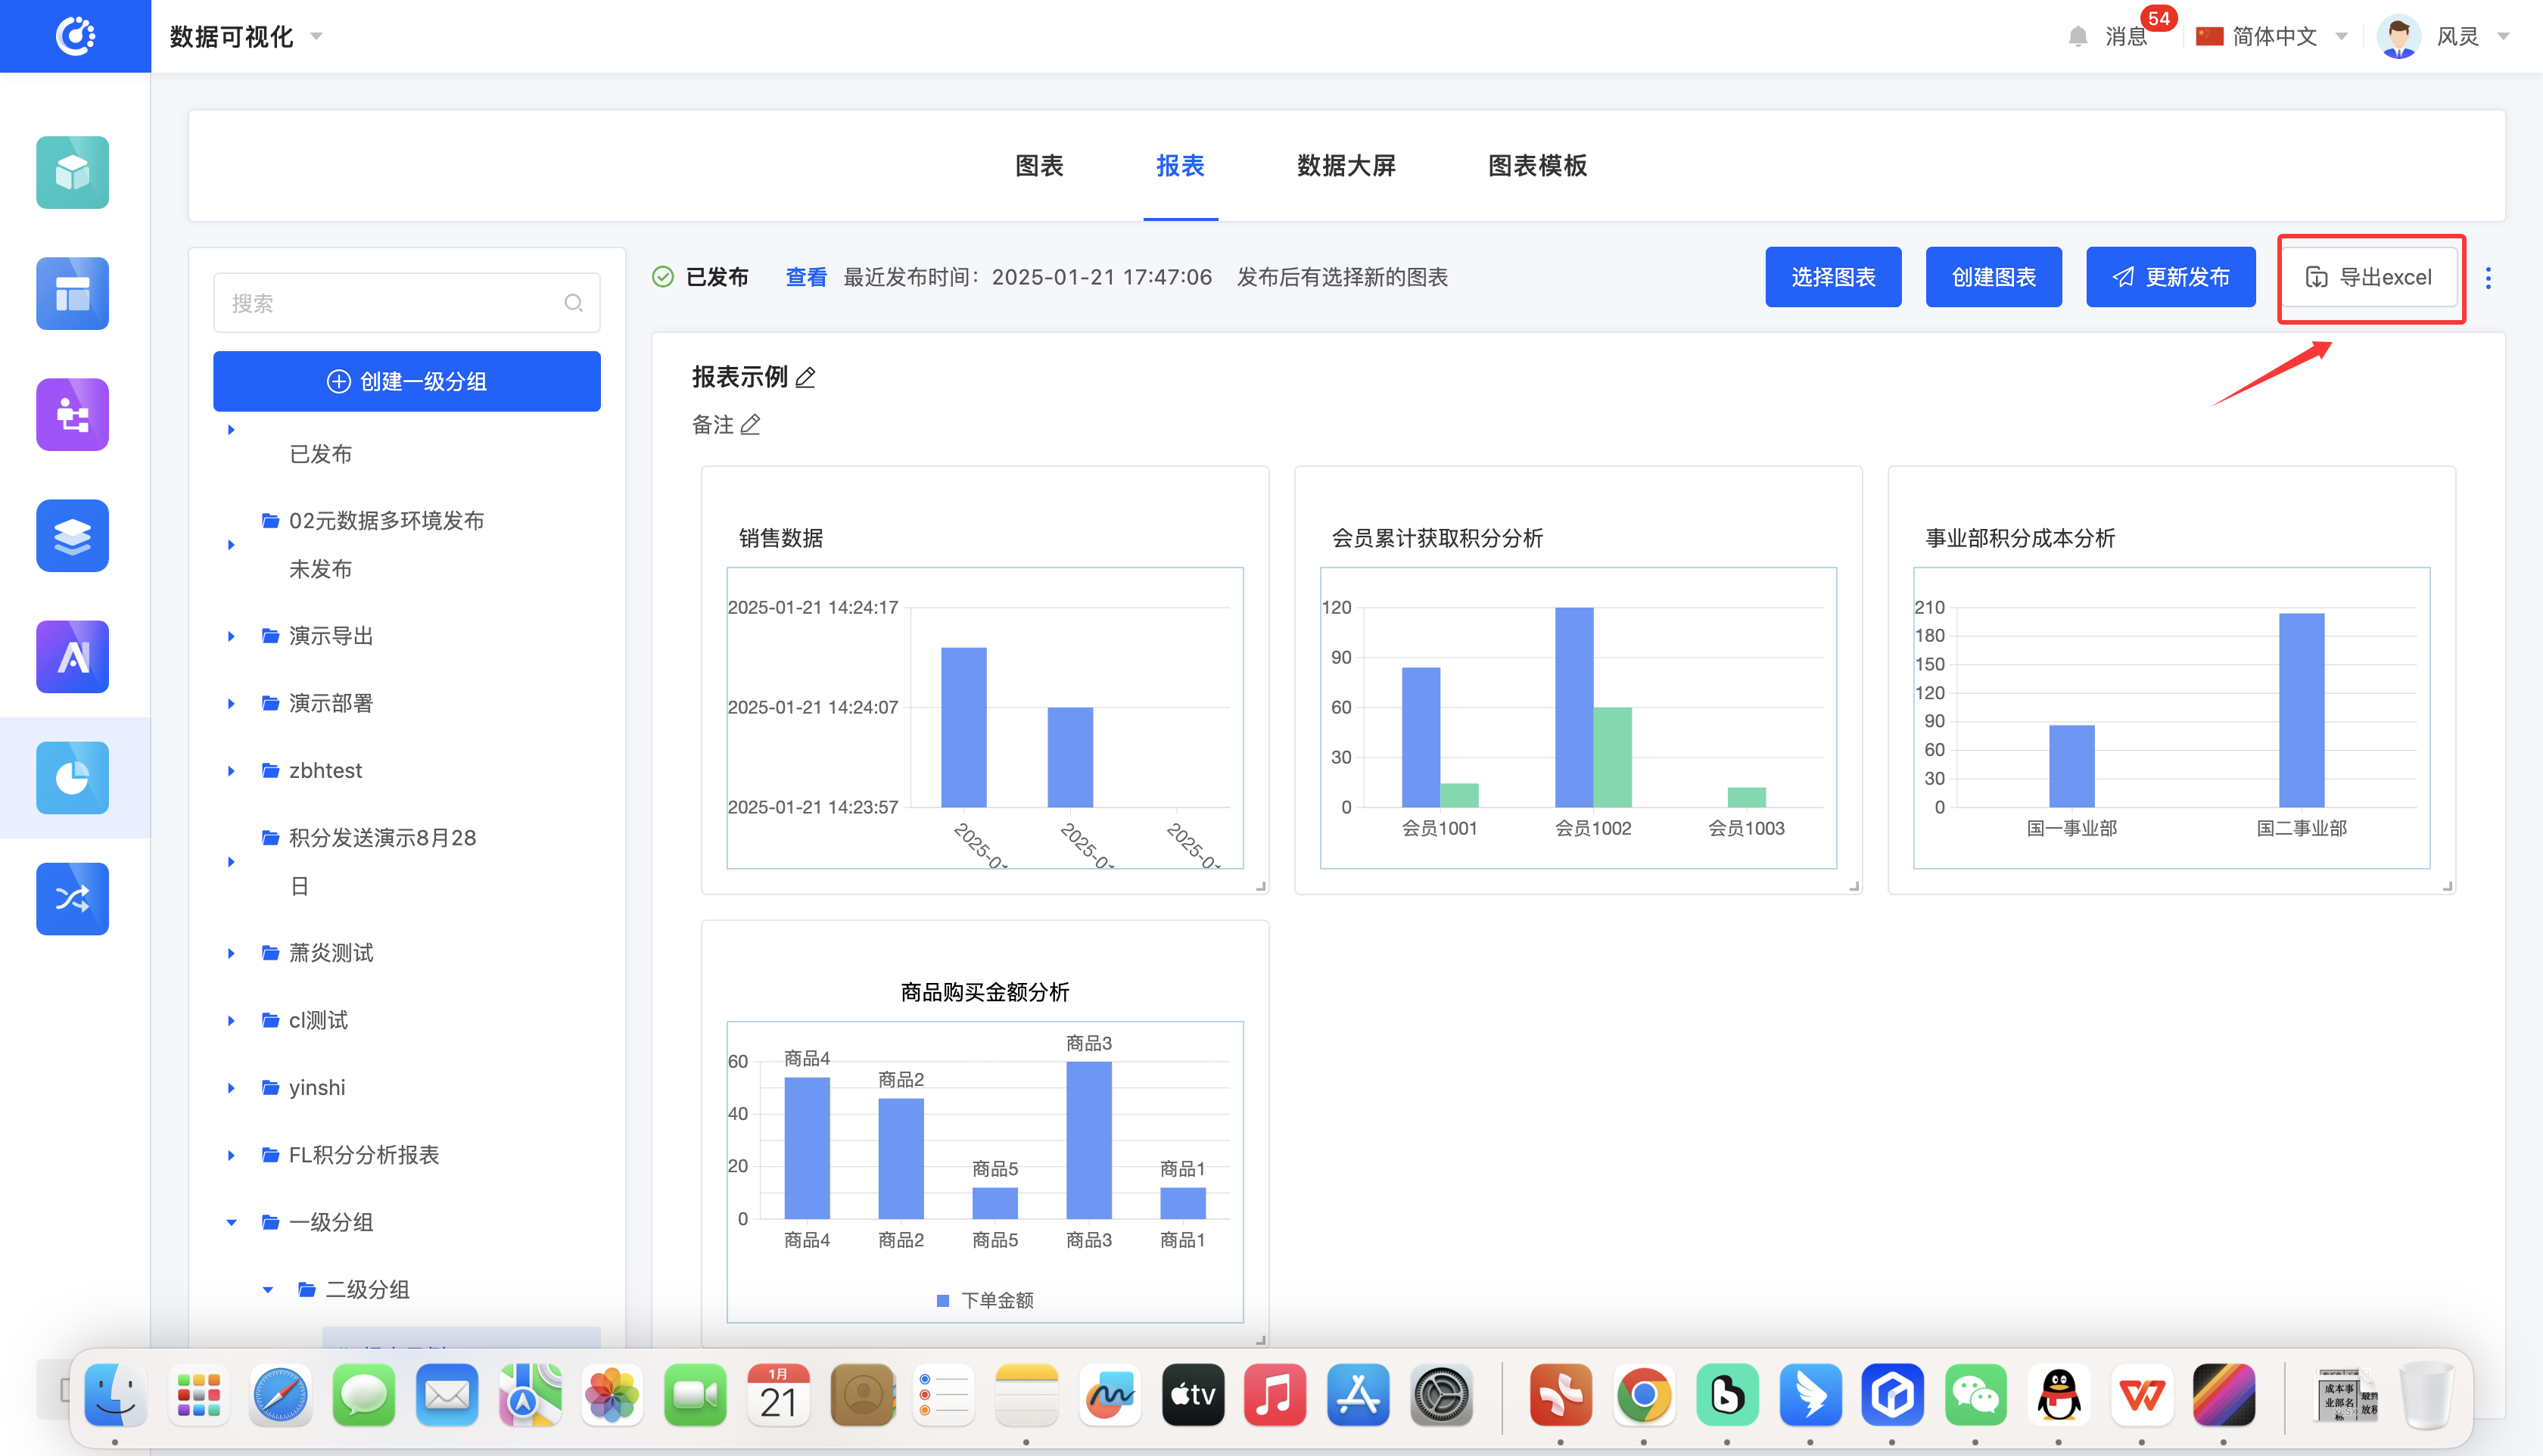
XII. Export to Excel
1. Function Introduction
You can export the chart data content in the report to a standardized Excel file format.
2. Operation Method
Click "Export to Excel" to export the chart data in the current report in Excel format.
XIII. Allow Others to Edit
1. Function Introduction
Supports customizing editing permissions. When the editing permission is turned off, non-creators cannot edit the content even if they log in.
2. Operation Method
Click the switch to change the function status.

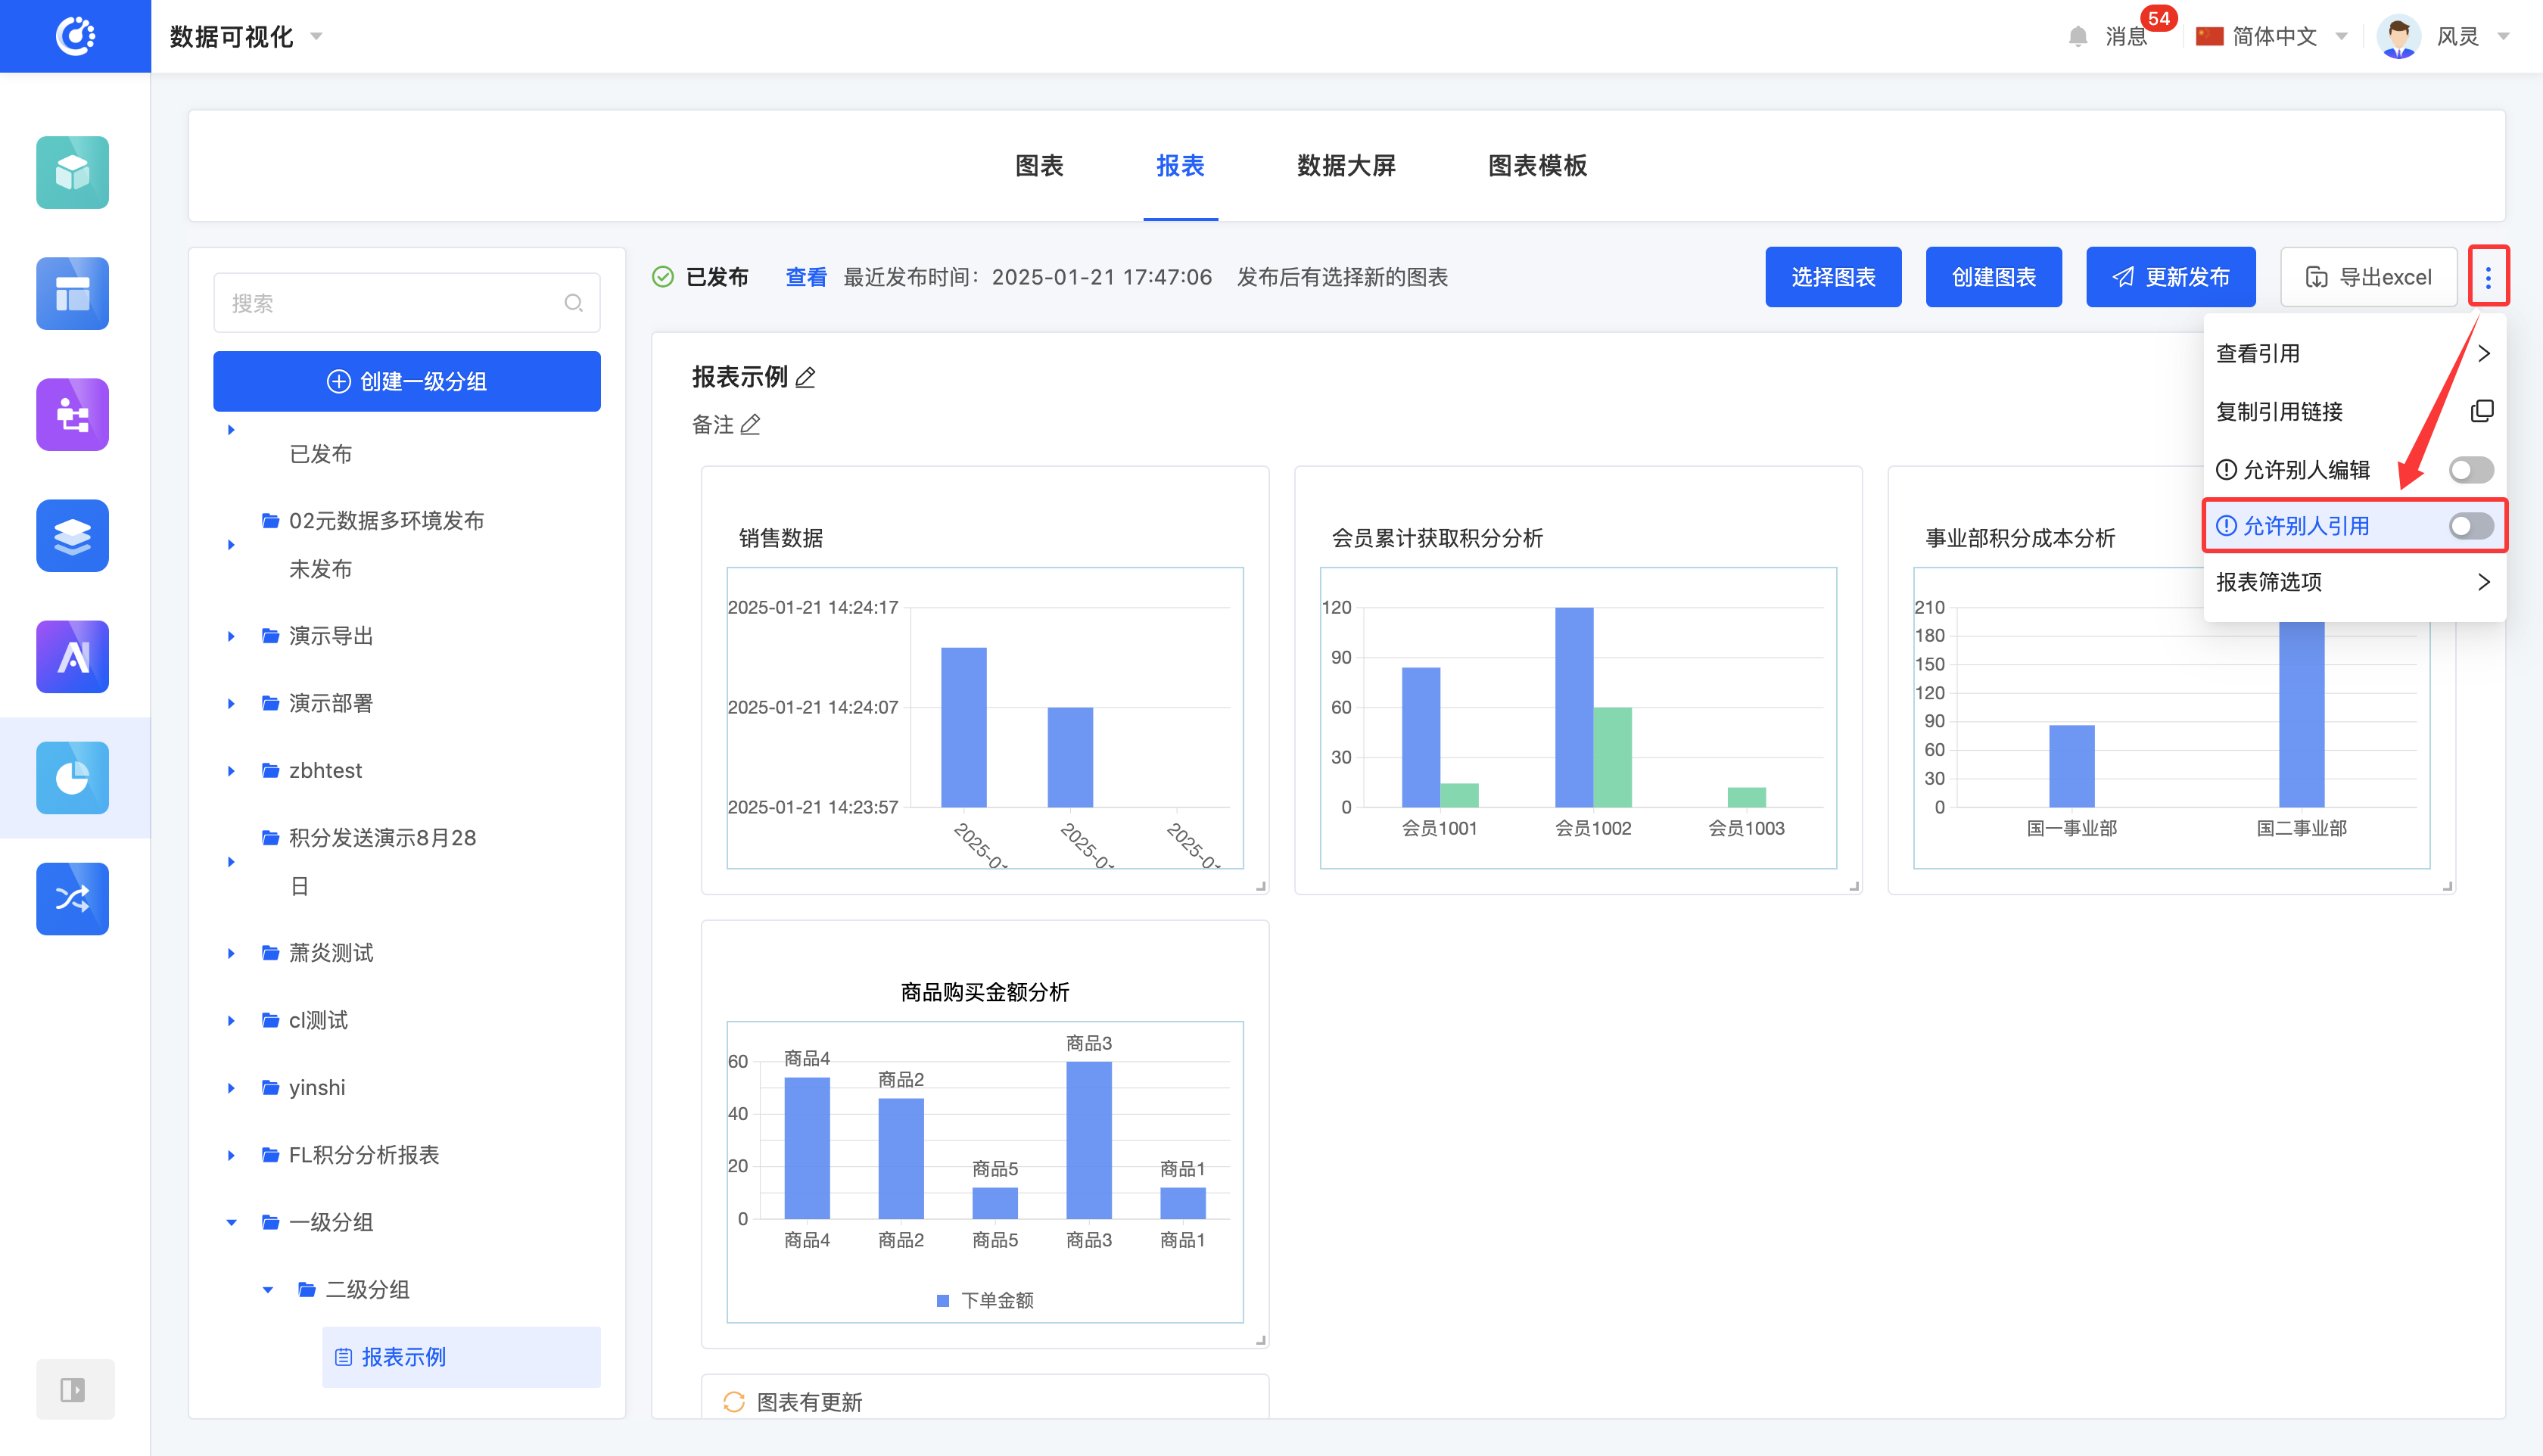
XIV. Allow Others to Reference
1. Function Introduction
Supports customizing reference permissions. When the reference permission is turned off, non-creators cannot reference the content even if they log in.
2. Operation Method
Click the switch to change the function status.
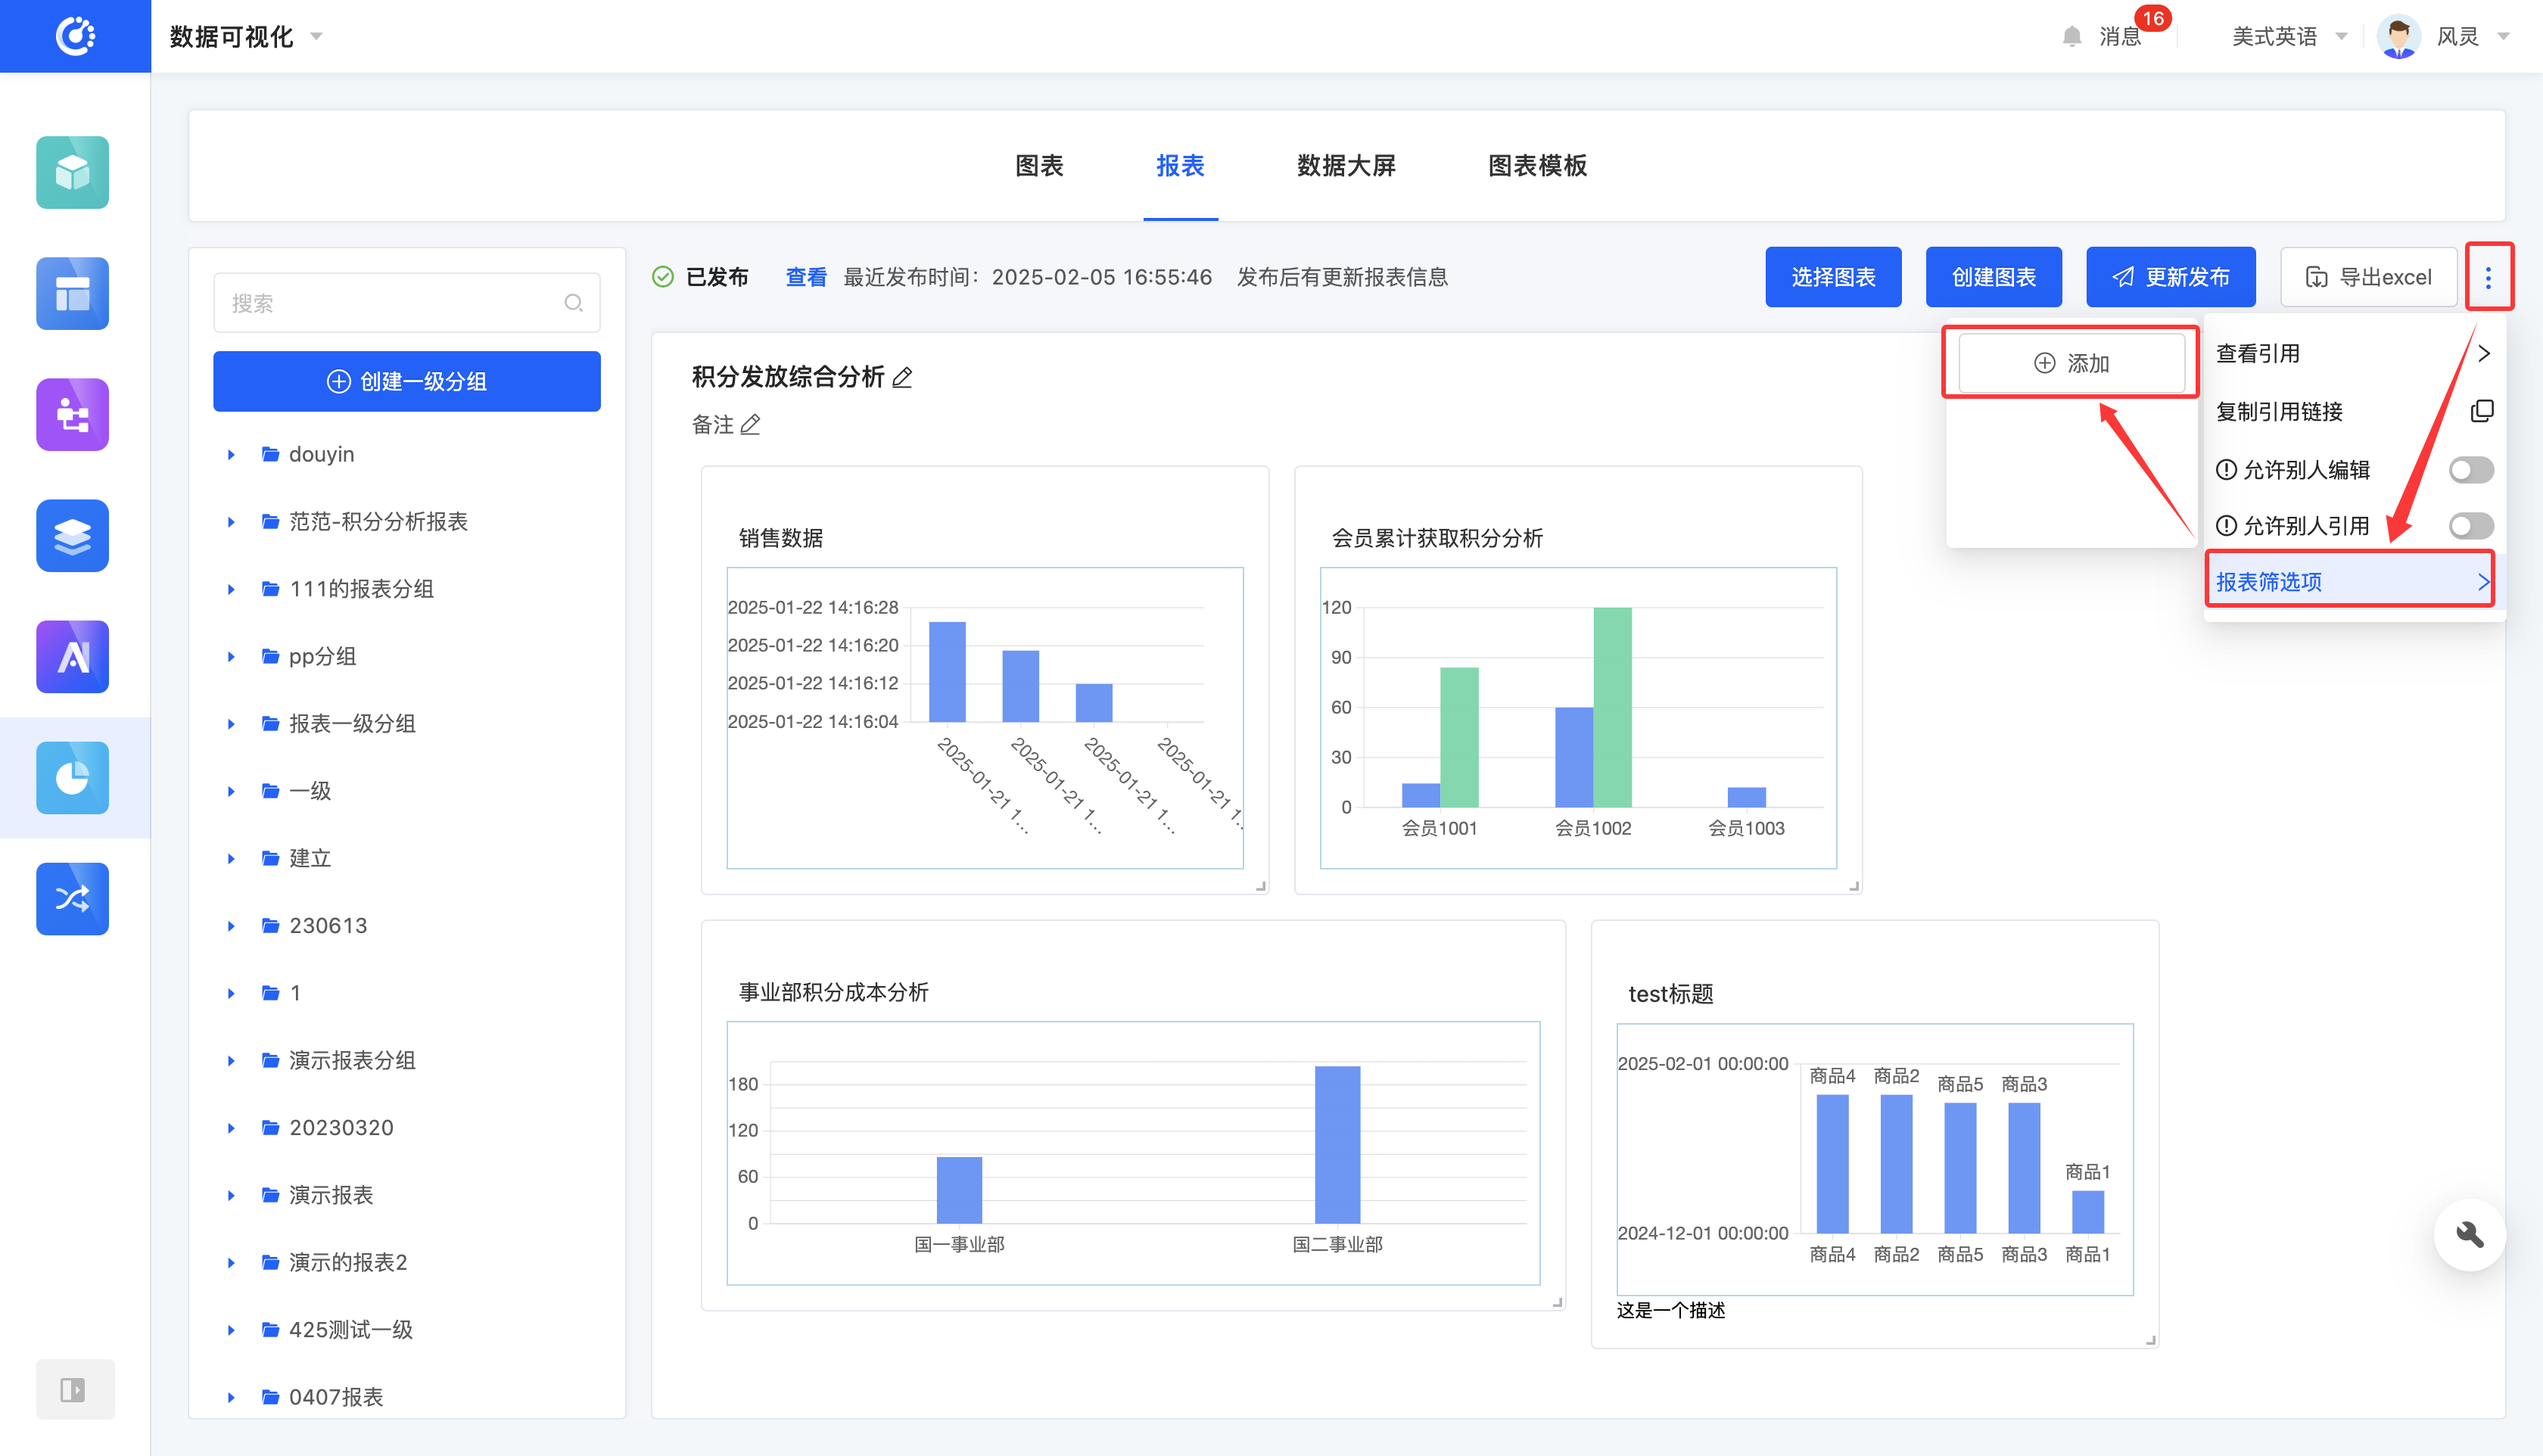
XV. Report Filter Options
1. Function Introduction
You can set time-related fields for the charts in the report as report filter options. When a specific time range is selected, the corresponding charts will automatically display the data within that time range.
2. Operation Method
Click "Add Report Filter Options", select the corresponding information on the pop-up page, and click "OK" to successfully set the report filter options.
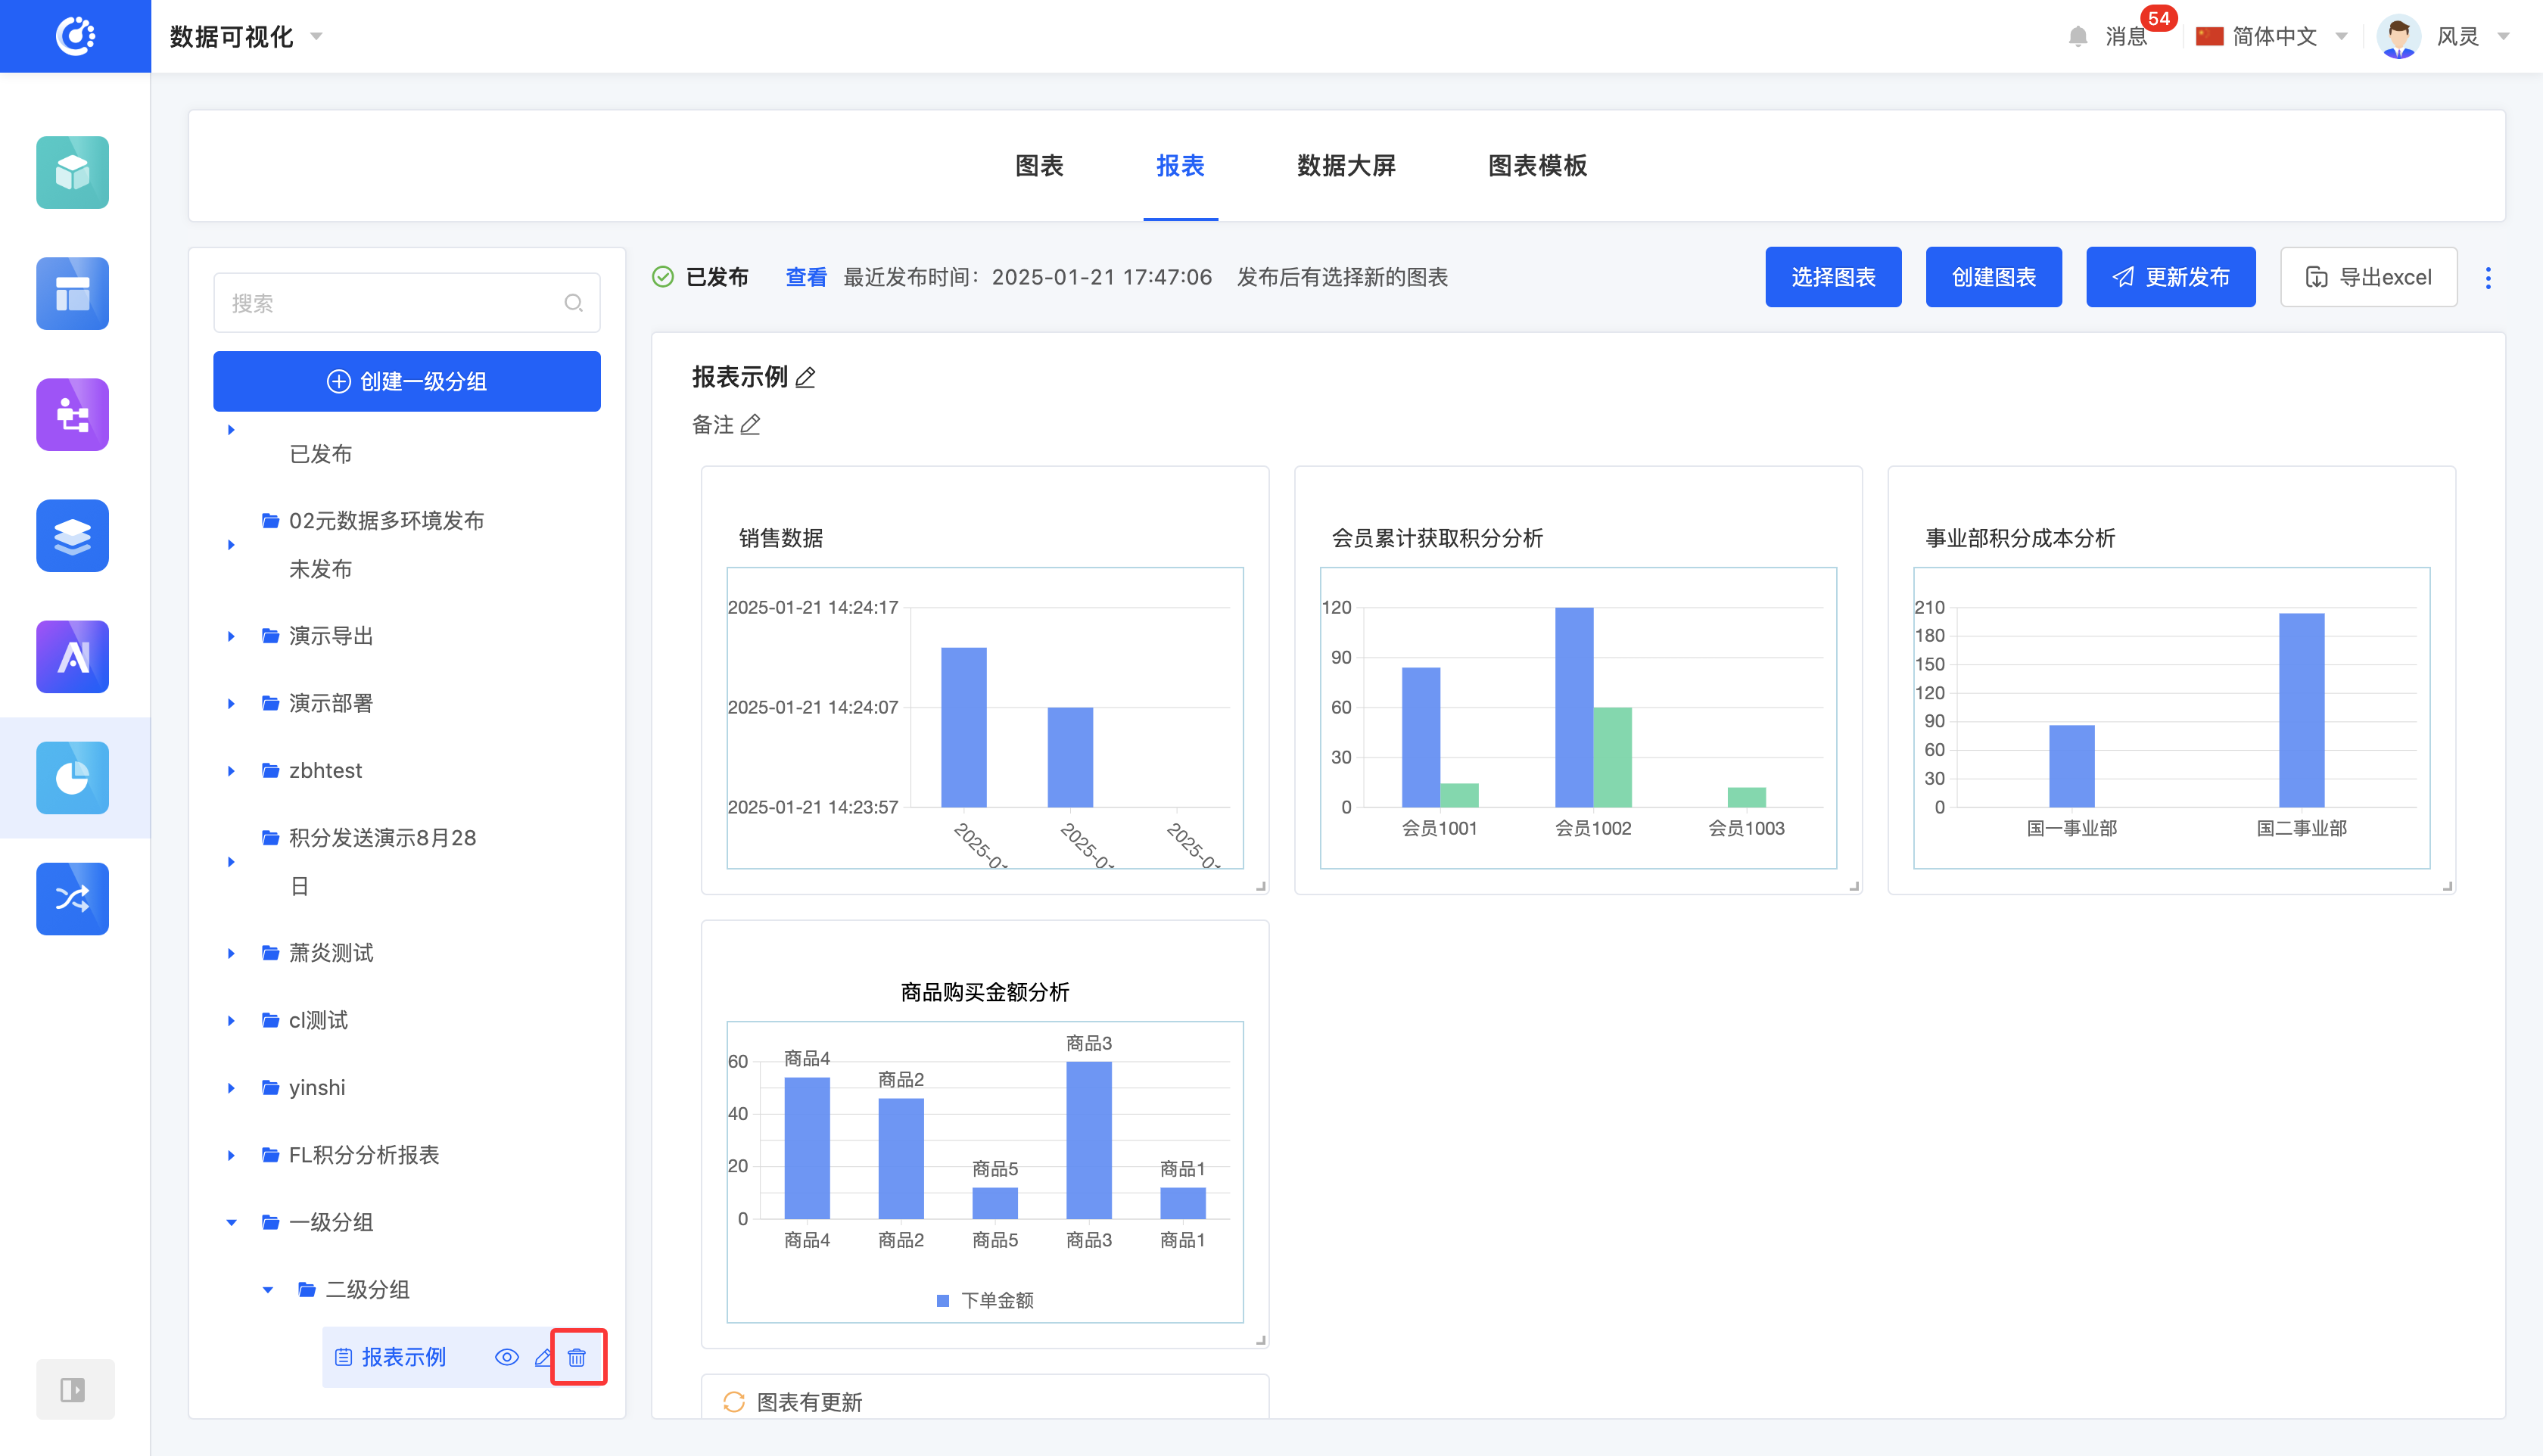
XVI. Delete a Report
1. Function Introduction
When a report is no longer needed, you can choose to delete it. If you are not sure whether to delete the report, you can hide it first.
Note
Before deleting, ensure that the report is not referenced by other designers; otherwise, the deletion operation cannot be performed.
Warning
Once a report is deleted, it cannot be restored. Please operate with caution!
2. Operation Method
Click the "Delete" icon, confirm the deletion, and the report will be deleted.
XVII. Attachment: Glossary
Term | Description |
|---|---|
| Chart | Refers to specific chart information. After inputting the data to be analyzed according to the chart template, a business chart will be generated. |
| Report | Designs the combined style of charts. Adding the charts to be displayed together to a single report forms a whole. You can adjust the proportion of individual charts on the report design page and publish the report. |